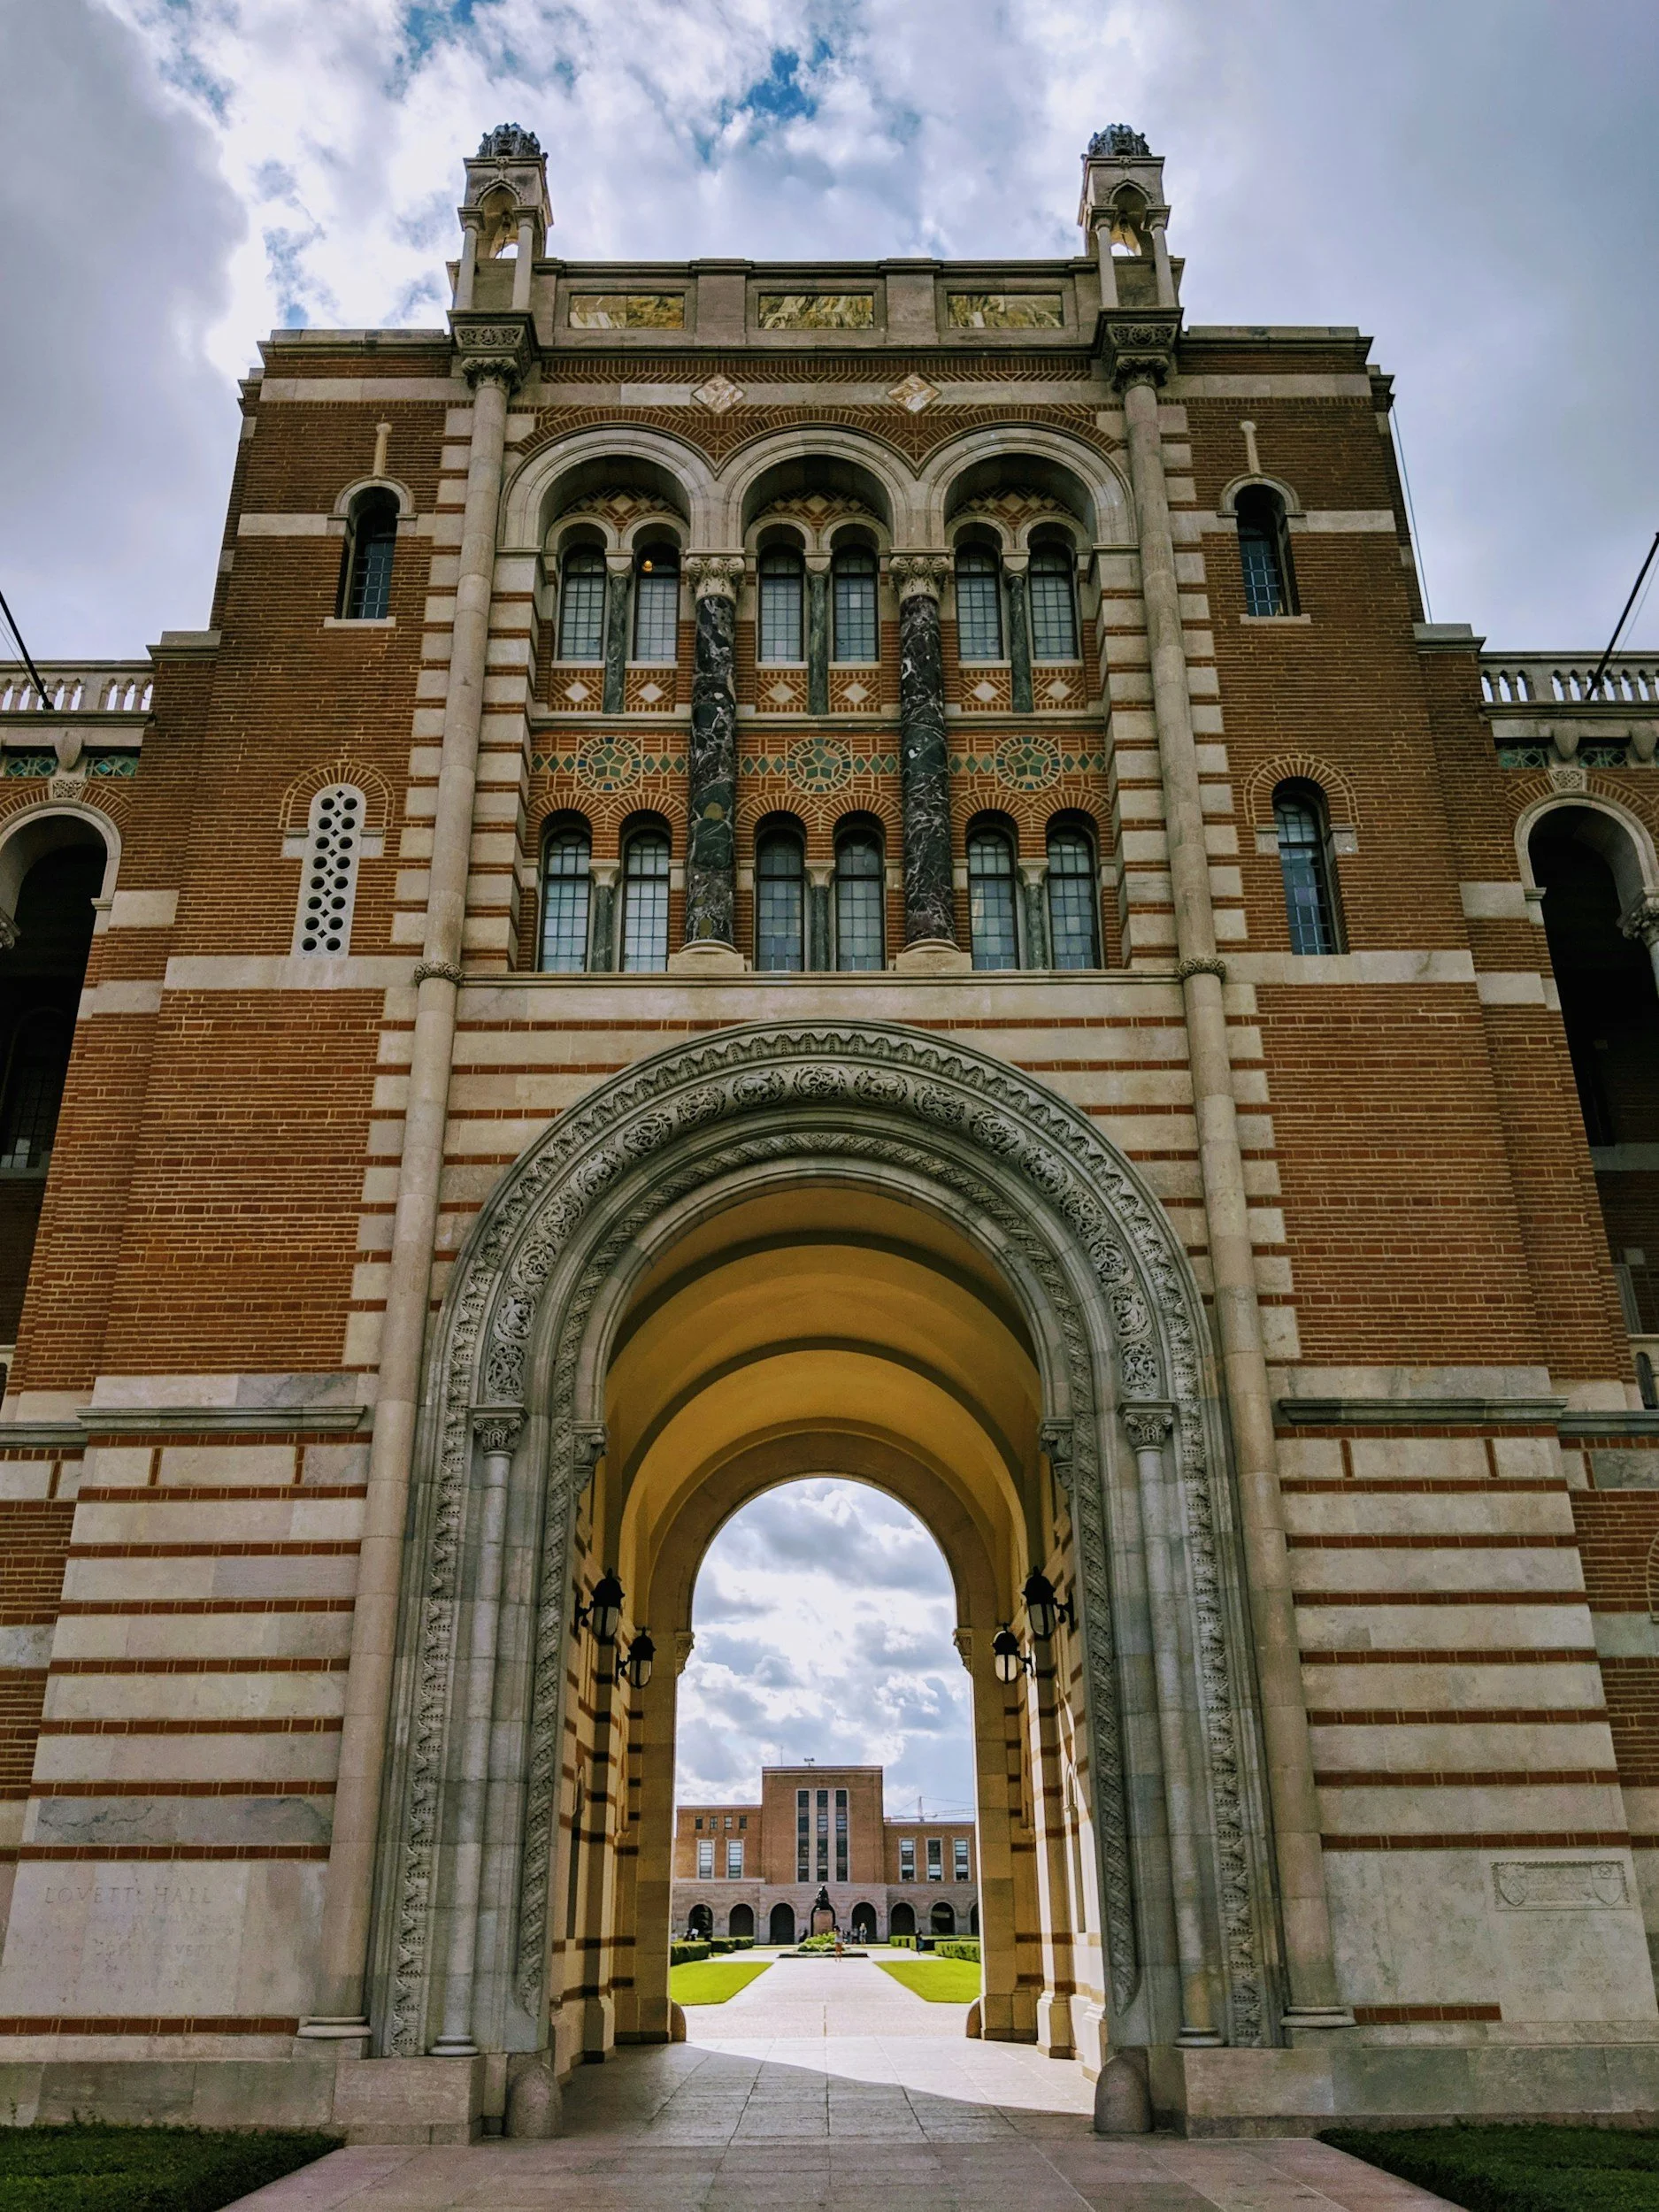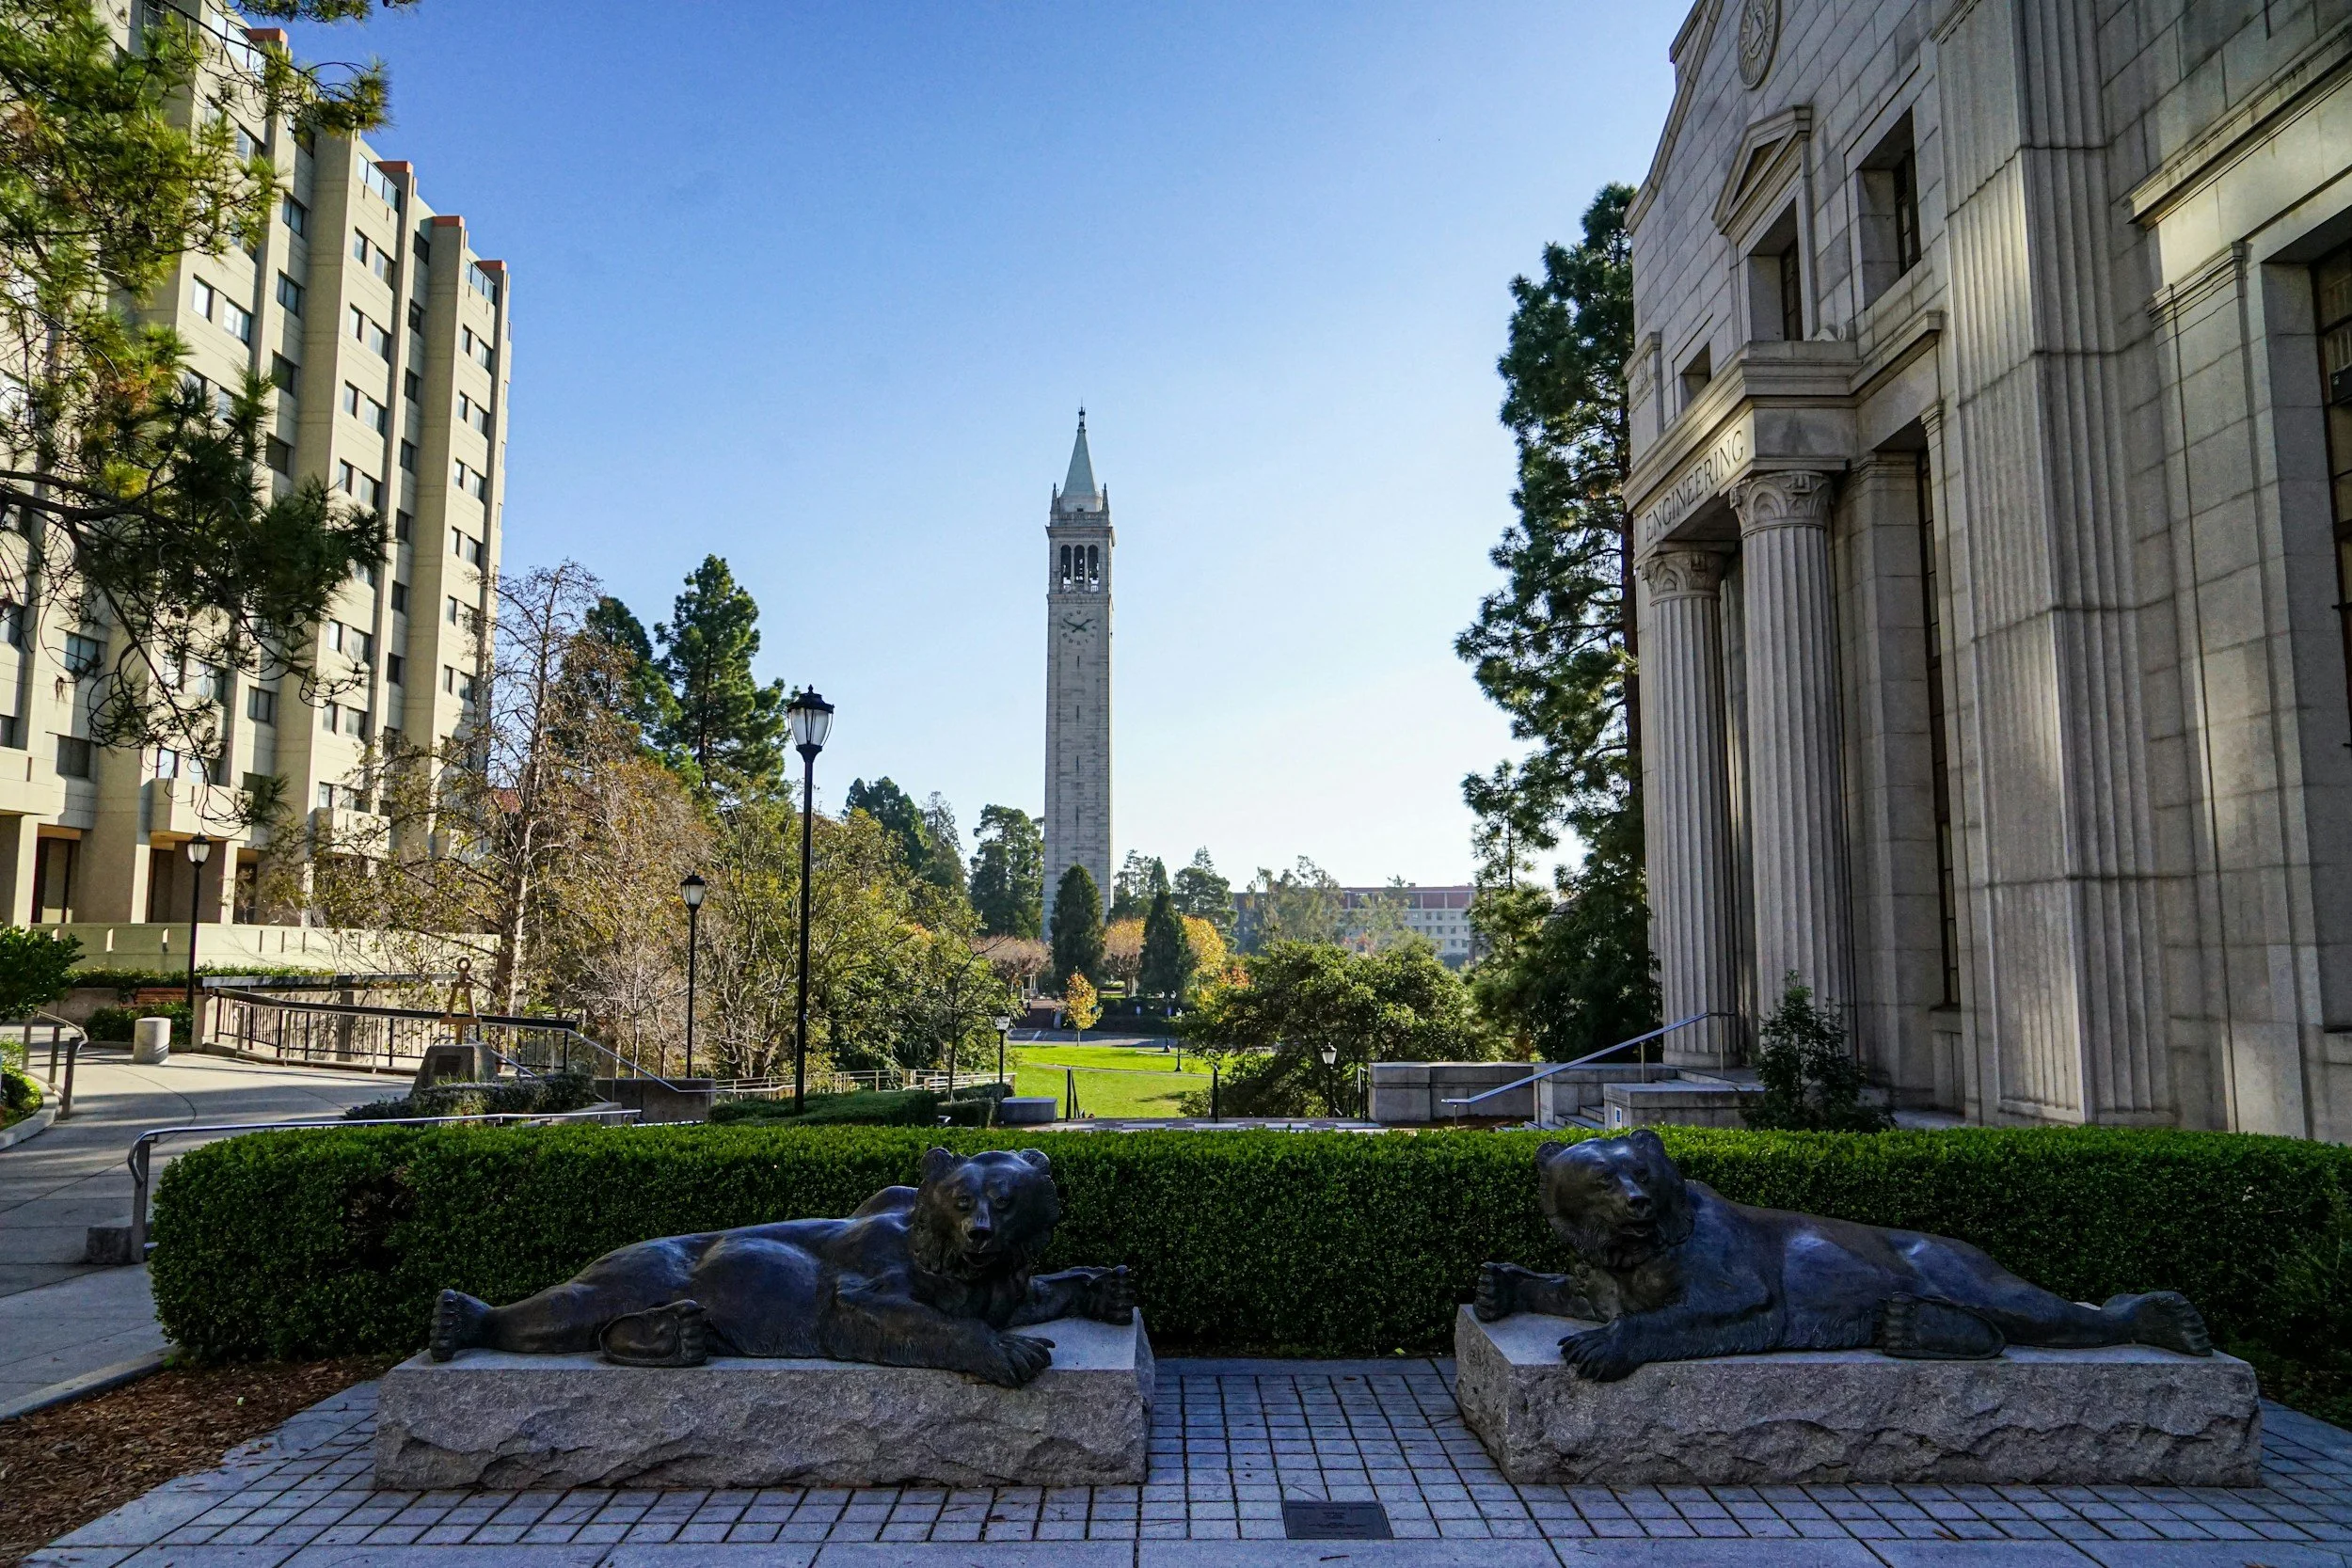
Boston College vs Villanova 2026

If you are weighing Boston College against Villanova, you are comparing two of the strongest Catholic universities in the country, but you are not comparing two versions of the same school. Boston College is the more selective option overall, and its Early Decision advantage has become one of the clearest strategic levers in its admissions process. Villanova is still highly selective, but it runs a different early structure, communicates its testing policy differently, and offers a campus culture that feels tighter and more service centered than BC's. This guide walks you through the numbers and the texture of daily life at each school so you can figure out which one actually fits you.
How BC and Villanova Compare on Selectivity
Boston College now sits at a meaningfully higher selectivity tier than Villanova. For the Class of 2030, BC's overall admit rate fell to 12.7 percent, while Villanova's landed at 29.6 percent. Both schools remain test optional, but you should know that BC's own research suggests testing still matters at the margins: about 75 percent of BC's admitted students in the 2024 to 2025 cycle chose to submit scores. Villanova will stay test optional through the 2026 to 2027 admissions cycle for the Class of 2031, though its Common Data Set filings note that testing is required for some applicants, including homeschooled students, so you should not treat "test optional" as identical at both schools.
Round by Round: Early Decision, Early Action, and Regular Decision
Neither school offers Restrictive Early Action, and neither one will penalize you for applying to a nonbinding EA program elsewhere. Beyond that, the two schools diverge. BC's early pathways are Early Decision I, Early Decision II, and Regular Decision, and both ED rounds are binding. Villanova also runs binding ED I and ED II, but it pairs those with a nonbinding, nonrestrictive Early Action option that BC does not offer at all.
Boston College's ED advantage has been substantial and fairly consistent. For the Fall 2021 entering class, BC admitted 39.1 percent of ED applicants against 17.3 percent of RD applicants, for an overall rate of 19.0 percent. In Fall 2022, the ED rate dropped to 28.1 percent and RD fell to 15.3 percent, with an overall rate of 16.7 percent. Fall 2023 saw ED climb back to 30.1 percent while RD slipped to 13.6 percent, for an overall rate of 15.6 percent. By Fall 2024, ED rose again to 33.4 percent against an RD rate of 13.8 percent, with an overall rate of 16.2 percent. For the most recent cycle, BC's admissions office describes 2024 to 2025 ED admits at roughly 30 percent against an overall rate of 14 percent, and the Class of 2030's overall rate fell further to 12.7 percent, though BC has not yet published exact Fall 2025 round by round figures. Across the years BC has reported cleanly, applying ED bought you somewhere between about 13 and 22 percentage points of admit rate advantage over RD.
Villanova's ED advantage is even larger in percentage terms. ED admit rates ran 59.6 percent for Fall 2021, 55.6 percent for Fall 2022, 49.5 percent for Fall 2023, 54.2 percent for Fall 2024, and 59.8 percent for Fall 2025, against overall admit rates of 25.2 percent, 23.4 percent, 25.1 percent, 27.0 percent, and 28.1 percent respectively. The catch is EA. Villanova's public CDS filings confirm that nonbinding EA exists and is genuinely nonrestrictive, but the university has only directly reported EA admit data once in this window, for Fall 2023, when the EA admit rate came in at 15.4 percent. In every other year reviewed here, Villanova's public filings do not expose EA applicant or admit totals, so you should be skeptical of any RD rate you see reconstructed for Villanova. It is not something you can responsibly back into from the public data.
The practical read for you: if BC or Villanova is genuinely your first choice and you can commit to binding ED, both schools reward that commitment heavily, and Villanova's raw ED numbers look even more favorable than BC's. If you are not ready to commit, Villanova's nonbinding EA at least gives you an early-round option that BC simply does not offer.
Testing Policies and Score Ranges
Both schools stayed test optional throughout this period, but their score bands crept upward, which tells you something about how many strong scorers were still applying and enrolling even without a submission requirement.
At BC, the enrolled middle 50 percent moved from SAT 1430 to 1510 and ACT 33 to 34 in Fall 2021, up to SAT 1450 to 1520 and ACT 33 to 35 in Fall 2022. Fall 2023 came in at SAT 1450, 1490, 1520 and ACT 33, 34, 34, and Fall 2024 rose again to SAT 1460, 1500, 1520 and ACT 33, 34, 35. Score submission rates dropped over the same window, from 33 percent SAT and 18 percent ACT in Fall 2021 down to 25 percent SAT and 11 percent ACT in Fall 2023, before ticking back up to 35 percent SAT and 12 percent ACT in Fall 2024. For the admitted Class of 2030, BC reports an average of 1500 SAT and 34 ACT among admits.
At Villanova, Fall 2021 data was published as section ranges rather than a composite, with EBRW 660 to 730, Math 690 to 760, and ACT 31 to 34. Fall 2022 came in at SAT 1390, 1440, 1480 and ACT 32, 33, 34. Fall 2023 and Fall 2024 both landed at SAT 1410, 1450, 1490 and ACT 32, 33, 34, and Fall 2025 rose slightly to SAT 1420, 1450, 1490 and ACT 32, 34, 34. Submission rates fell from 28 percent SAT and 17 percent ACT in Fall 2021 down to 19 percent SAT and 9 percent ACT by Fall 2024 and Fall 2025. Villanova's Class of 2030 admitted profile lists a range of 1440 to 1520 SAT and 33 to 35 ACT, and the school notes that 47 percent of admitted students applied test optional.
One caution worth keeping in mind: the CDS figures above describe enrolled first-years, while the newest Class of 2030 numbers for both schools describe admitted students, not enrolled ones. They are both useful, but they are not answering exactly the same question.
Location and Access to the City
BC sits in Chestnut Hill, about six miles west of downtown Boston, and the MBTA Green Line B branch terminates right on campus. That gives you a suburban, self-contained "Heights" campus feel with genuine, easy access to a major city whenever you want it. Boston's hospitals, finance firms, media outlets, and tech companies sit close enough to meaningfully shape internships and post-graduation recruiting.
Villanova is positioned differently. It sits twelve miles west of Philadelphia on the Main Line, with three rail stops on campus, and its own materials emphasize that New York is roughly 95 miles away and Washington, D.C. is roughly 135 miles away. You get strong access to Philadelphia and reasonable access to two other major cities, but the day-to-day campus environment is more self-contained and residential than BC's. Neither setup is objectively better. BC feels like a university orbiting a city, while Villanova feels like a community with unusually good rail access to several cities.
Campus Culture and Traditions
Both schools are Catholic, but the traditions behind that identity are not interchangeable. BC is Jesuit, and its culture leans toward intellectual breadth, reflection, and formation of the whole person. Villanova is Augustinian, and it describes itself in terms of a community built on truth, unity, and love, with a stronger emphasis on interiority and communal belonging.
BC lists more than 273 student-run groups, and its defining traditions tie directly to its location: Marathon Monday is a campus-wide event built around BC sitting at Mile 21 of the Boston Marathon, and Red Bandanna has become a central service and identity tradition. The overall feel is expansive, city-facing, and shaped by a large research-university scale.
Villanova reports 300 student groups, about 30 club and intramural sports options, and 98 percent of first-year students living on campus. Its signature traditions are strikingly service oriented. The St. Thomas of Villanova Day of Service is one of the largest single-day community service initiatives in the Delaware Valley, and the university describes its Special Olympics Fall Festival as the largest student-run Special Olympics event in the world. Add NOVAdance and Nova Nation basketball spirit, and you get a culture that is tighter, more village-like, and more organized around shared participation than BC's.
On diversity metrics, BC's public data is somewhat more granular. For the enrolled Class of 2028, BC's Black student share fell from 7 to 6 percent, Hispanic share rose from 13 to 14.4 percent, and Asian American share rose from 14.6 to 16.2 percent, while the admitted Class of 2030 was 9 percent international and 11 percent first generation. Villanova's public materials lean more on geographic and international breadth: its Class of 2030 profile reports students from 50 states and 73 countries, and its enrollment figures run around 6,700 to 7,009 total undergraduates depending on the source.
Academic Structure, Core Curriculum, and Honors
BC requires a university-wide 15-course core across humanities, natural sciences, and social sciences, refreshed through interdisciplinary offerings like Complex Problems and Enduring Questions. In Morrissey College specifically, you would complete at least 45 credits of core work, a major, and intermediate-level language proficiency. It is a broad, classic liberal-arts design layered on top of a large research university.
Villanova's core is similarly broad but somewhat more scaffolded at the school level, with explicit foundation, language, math and statistics, and lab-science requirements. Villanova frames its core as tightly connected to its Augustinian identity, so it reads less like generic liberal-arts distribution requirements and more like formation within a specific community.
If a branded honors cohort matters to you, that is one of the more concrete differences between these schools. BC wound down its former Morrissey College Honors Program for incoming students after 2017, and while departmental honors pathways and thesis work still exist, there is no single flagship honors program anymore. Villanova, by contrast, maintains a prominent University Honors Program built around small interdisciplinary seminars, research opportunities, and a capstone thesis, and the university markets it as an intellectual home for its strongest students.
Popular Majors and Undergraduate Research
BC's most popular majors are finance, economics, and biology, and the school offers 60-plus graduate programs along with fifth-year B.A./M.A. and B.S./M.S. options in some Morrissey disciplines. That graduate density shapes the undergraduate experience even if you never touch a graduate program yourself.
Villanova leans harder into undergraduate professional identity. The Villanova School of Business advertises seven majors and two co-majors, the College of Liberal Arts and Sciences advertises more than 40 majors and 15 combined bachelor's and master's programs, and the university highlights combined tracks like JD/MBA along with department-level combined degrees in fields such as mathematics and statistics. Villanova's Center for Research and Fellowships also makes undergraduate research unusually visible, with a peer-reviewed undergraduate journal, a summer fellows program, and a first-year research match program. BC certainly supports undergraduate research too, but its public identity leans more on the core curriculum and its larger research-university ecosystem than on one branded undergraduate research funnel.
Which School Is the Better Fit for You?
If you want a denser, more nationally competitive admissions environment, real day-to-day access to a major city, and a research-university atmosphere with a large graduate and professional footprint layered over a classic liberal-arts core, BC is probably the stronger fit. If you want a more bounded and communal undergraduate experience, with a clearly branded honors program, professional schools that feel central rather than peripheral to undergraduate life, and a culture built around visible, large-scale service and basketball-driven school spirit, Villanova is probably the stronger fit. Both are excellent schools. The honest differentiator is not prestige, it is the kind of daily environment you actually want to live in for four years.
A Few Caveats on the Data
You should treat Villanova's round-by-round admit rates with a bit more caution than BC's. Villanova's CDS filings clearly confirm ED and nonbinding EA exist, and they directly report EA counts for Fall 2023 only, so a clean RD rate cannot be responsibly reconstructed for Villanova across every year in this comparison. BC's exact ED and RD figures run cleanly through Fall 2024, while the newest Class of 2030 story is described only in rounded terms by BC's own admissions office. And remember that CDS score bands describe enrolled first-years, while both schools' newest class profiles describe admitted students, which is a related but not identical population.
If you want to learn what you can do right now to optimize your application for either Boston College or Villanova, schedule a free consultation with an admissions expert today.