RPI VS RIT 2026
Choosing between Rensselaer Polytechnic Institute and Rochester Institute of Technology comes down to one fundamental question. Do you want a smaller, research-intensive tech institute with a concentrated identity, or a larger career platform built around one of the most aggressive co-op machines in the country? Both schools will get you a strong outcome. But they are designed for different kinds of students, and understanding that difference before you apply will sharpen both your list and your essays.
The Core Difference
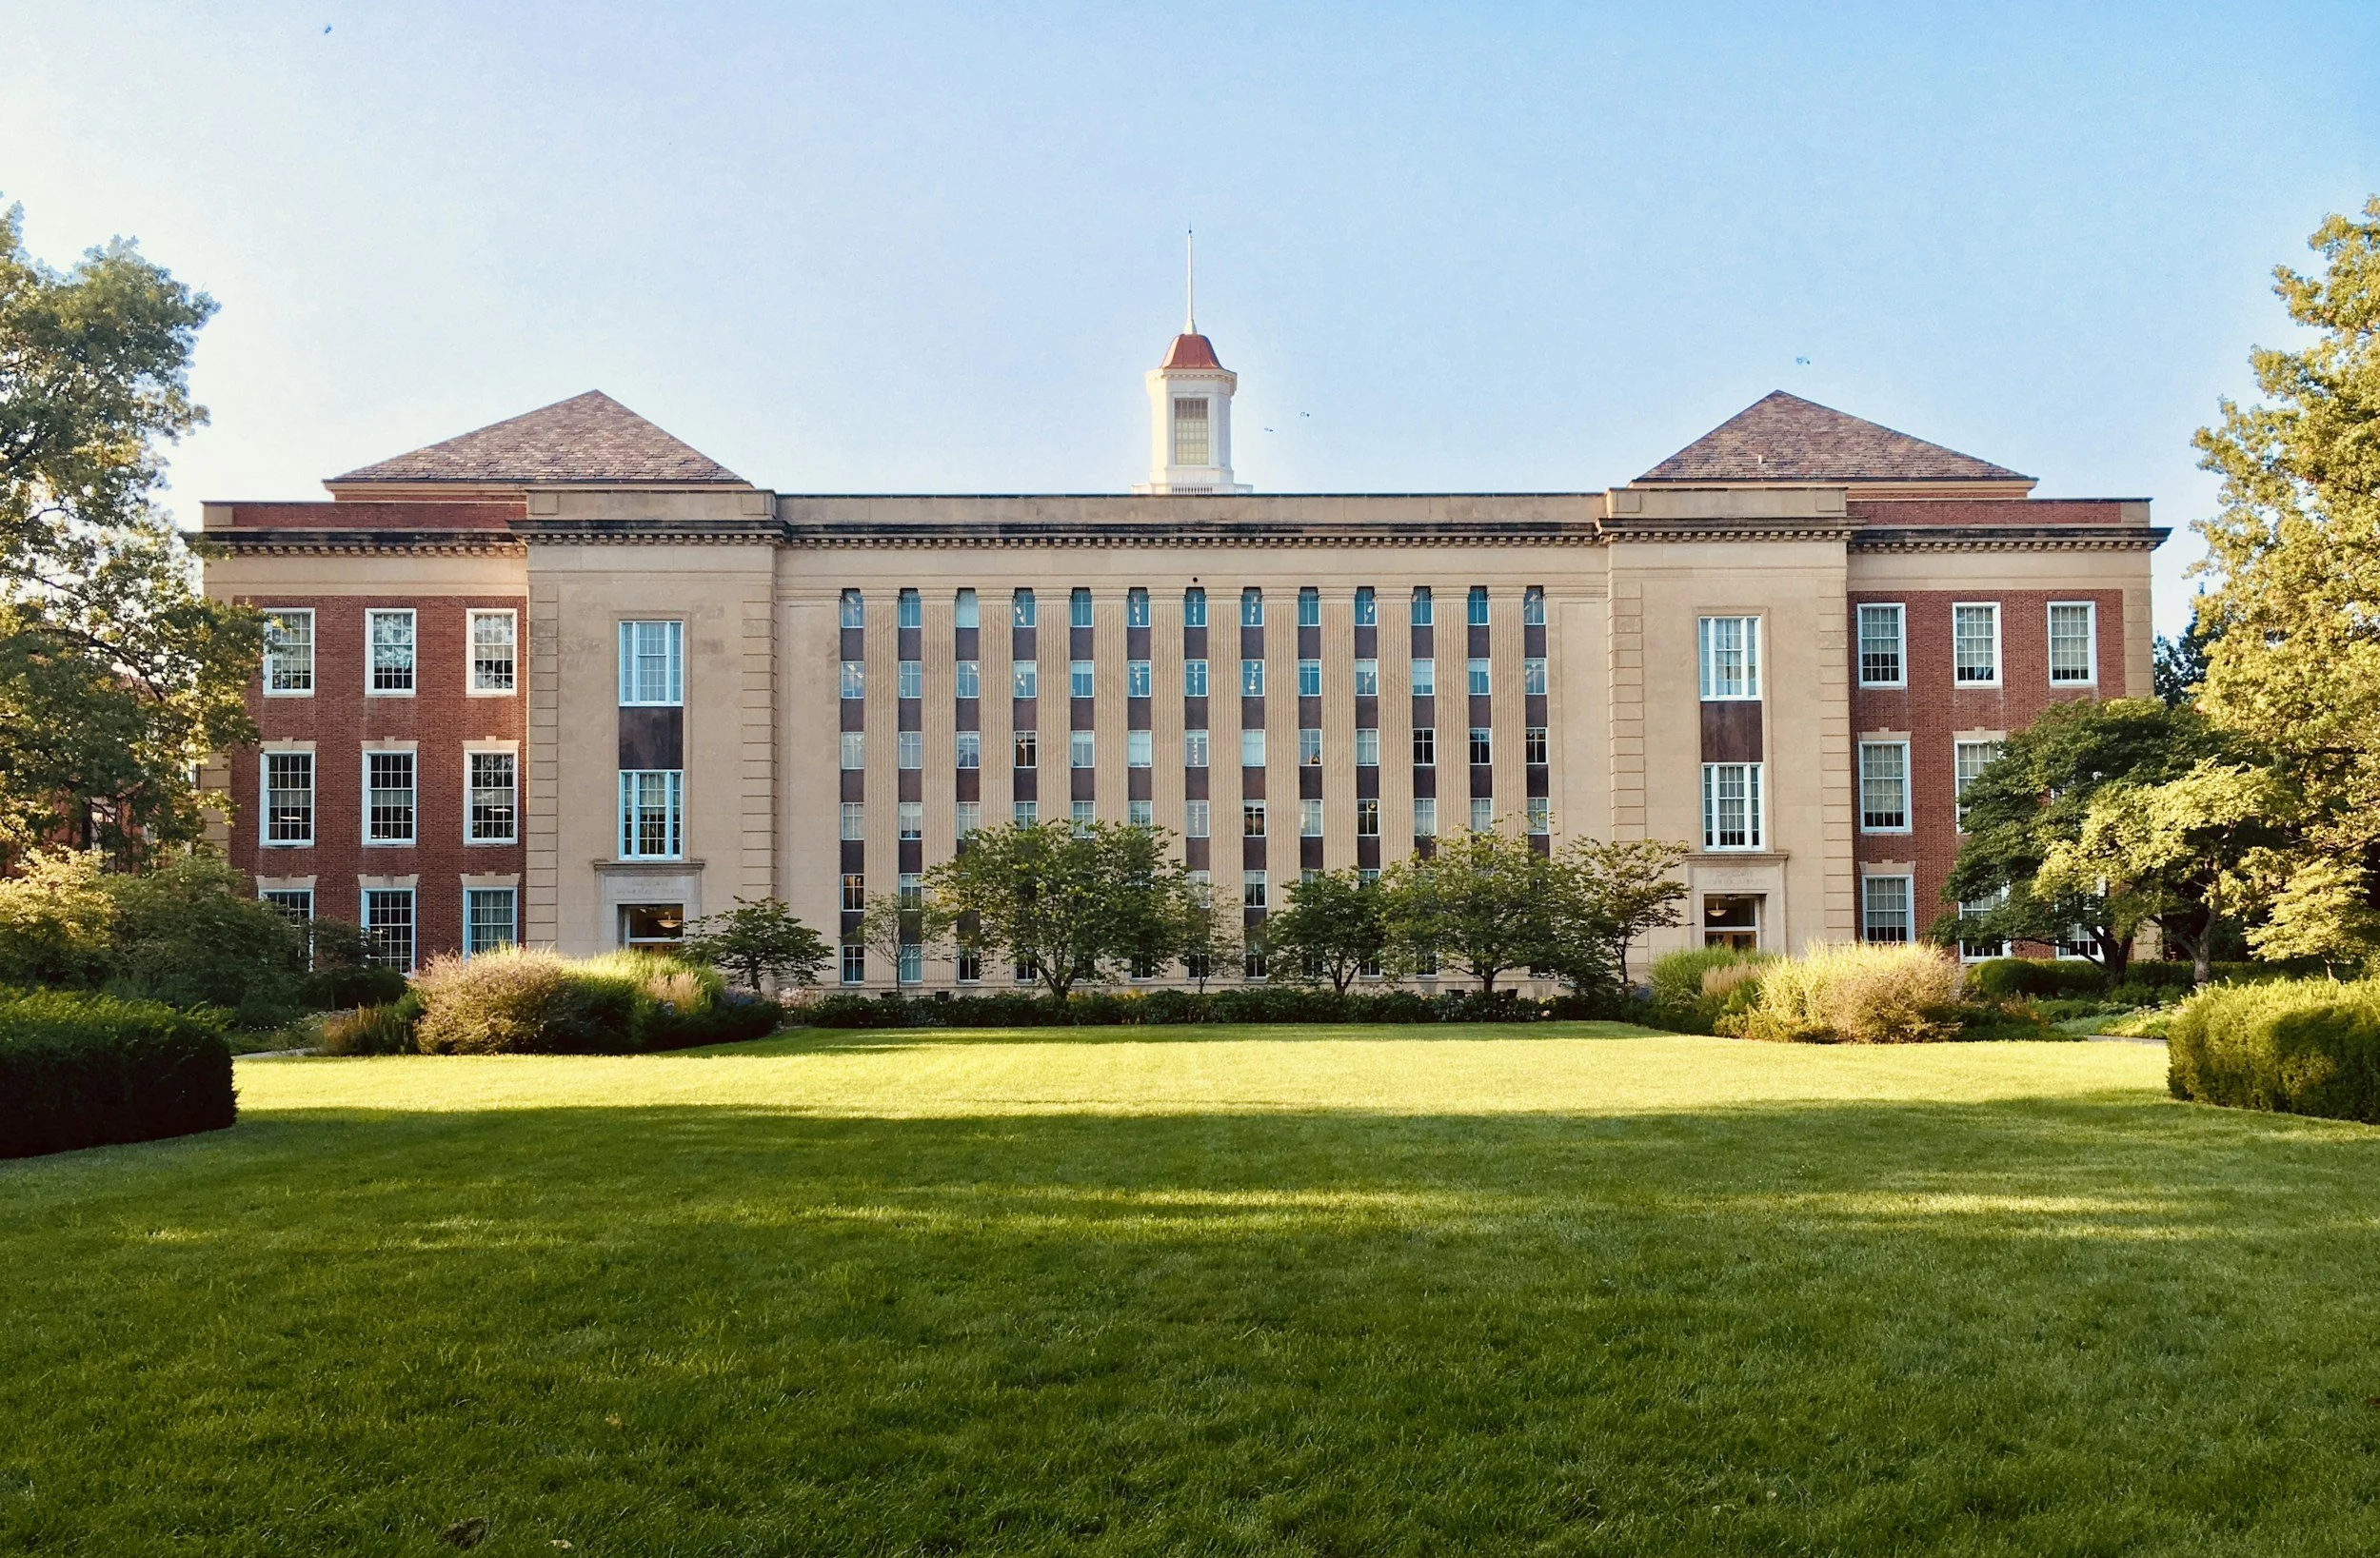
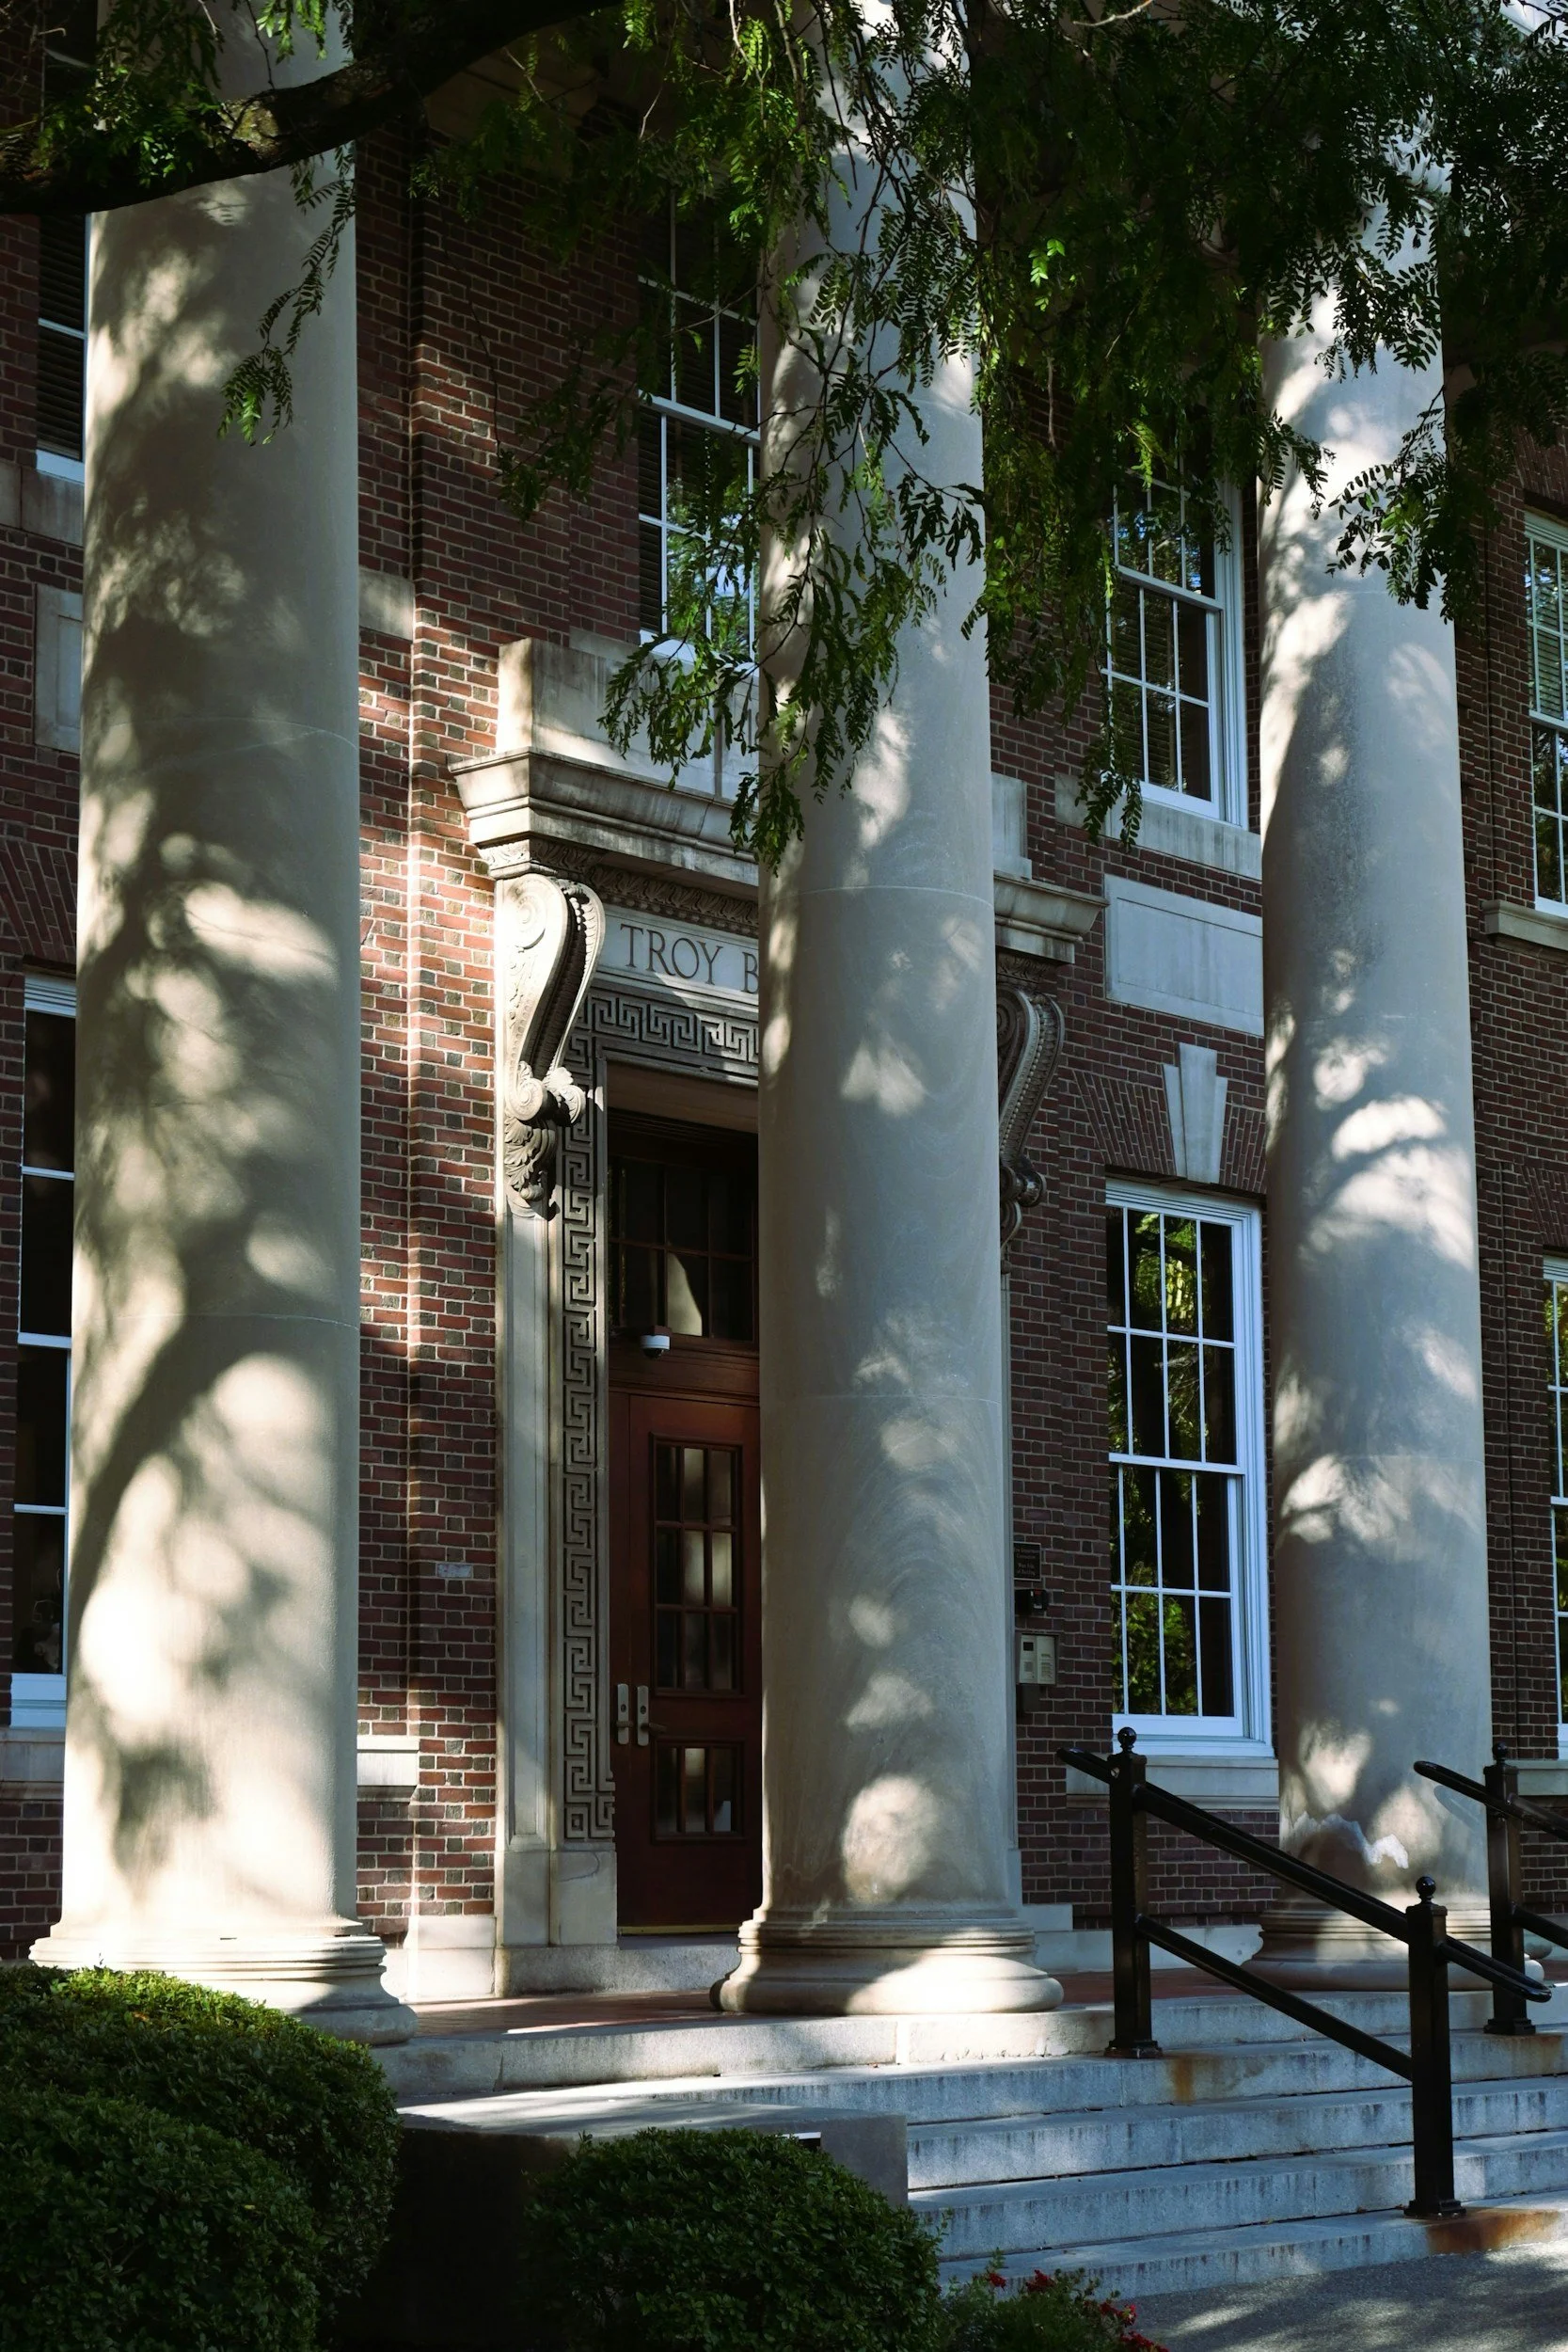
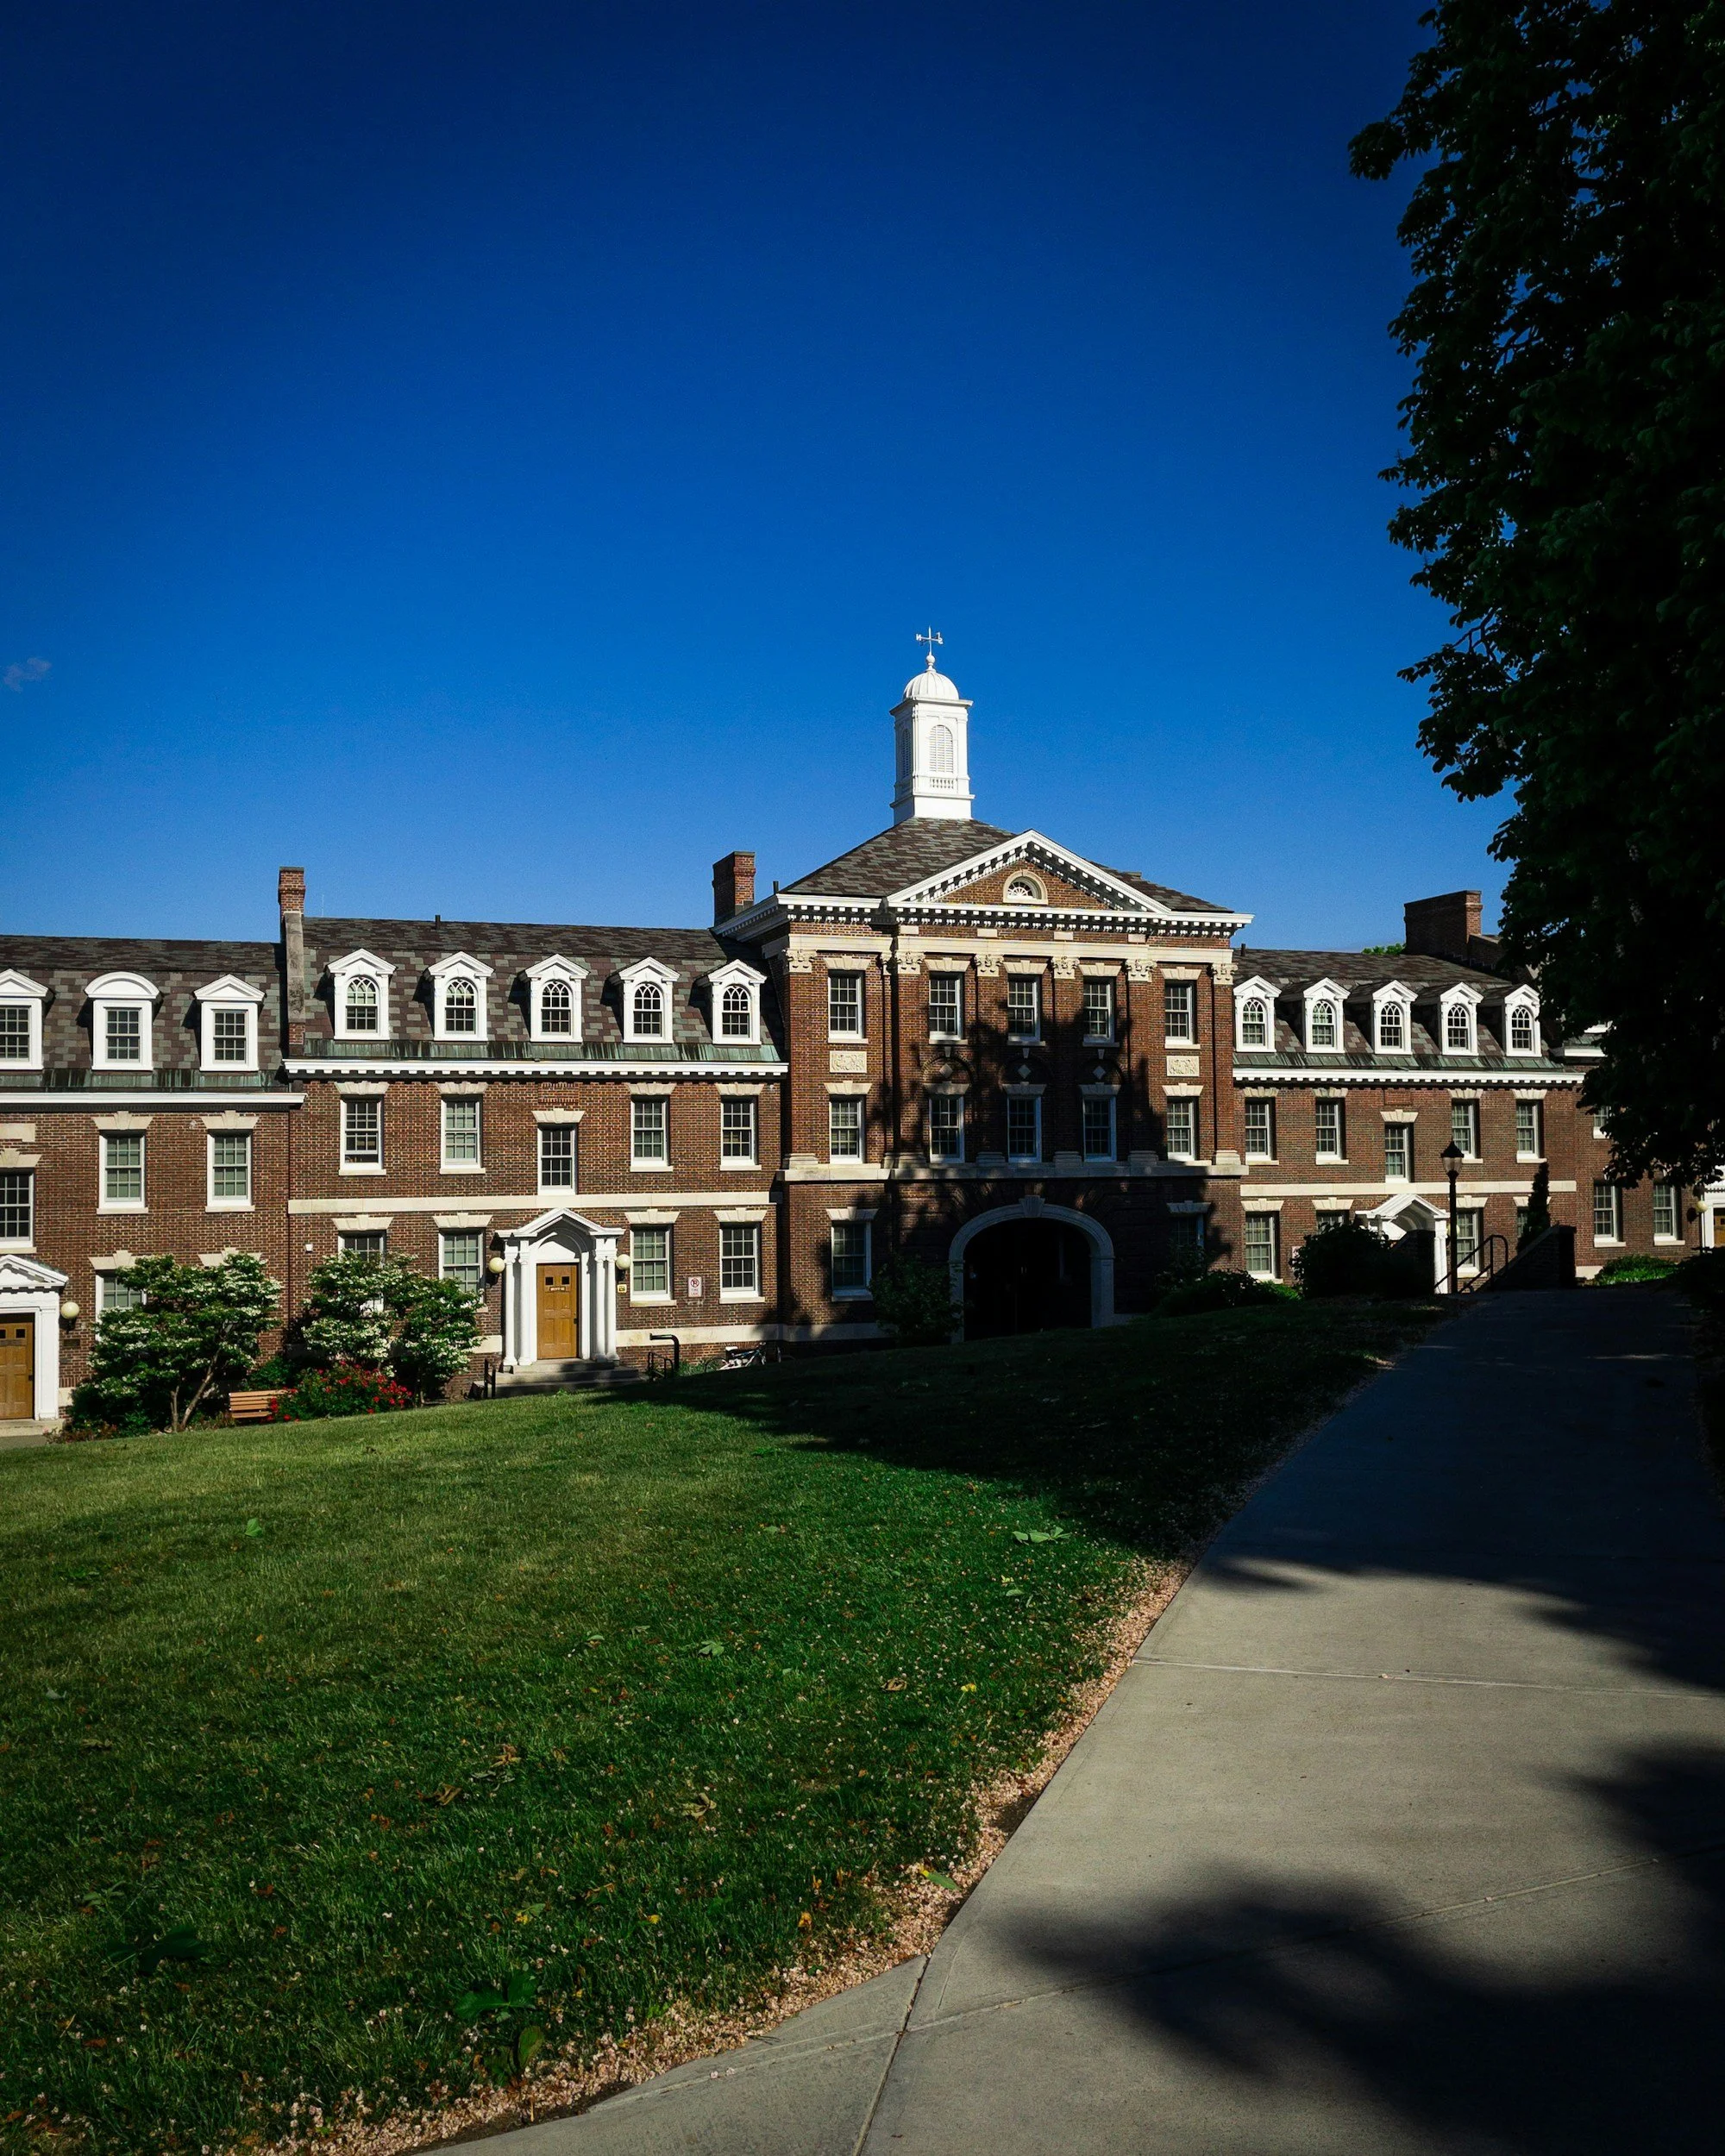
RPI is a smaller school with a tighter academic identity. It enrolls about 5,687 degree-seeking undergraduates, runs a 14:1 student-to-faculty ratio, and reports that more than 70% of undergraduates participate in research. Its programs span engineering, science, architecture, management, IT and web science, and humanities and social science, with technology threaded through all of it. The campus sits on a hill above Troy in New York's Capital Region, and the feel it produces is compact, institute-centered, and academically intense.
RIT is a substantially larger school. One widely cited profile puts its undergraduate enrollment around 14,000 students. It sits in Henrietta, a suburb of Rochester, and its campus culture is more plural than RPI's by design. RIT houses the National Technical Institute for the Deaf, a major institutional identity marker that shapes everything from physical infrastructure to social norms. It also runs 29 inter and national fraternity and sorority organizations and operates a transportation system that includes free ADA-compliant shuttles and connections to Rochester's regional bus network.
If RPI feels like a tech campus attached to a small city, RIT feels like a large university system plugged into a midsize metro area. Neither description is a criticism. They are just different things.
Admissions Selectivity
Both schools run Early Decision I, Early Decision II, Early Action, and Regular Decision rounds. Both ED rounds are binding at both schools. EA and RD are nonbinding.
At RIT, the Early Decision advantage is well-documented in official Common Data Set files going back to 2021. ED admit rates over that period have run at approximately 82.9% for the fall 2021 entering class, 79.0% for fall 2022, 72.8% for fall 2023, and 72.2% for fall 2024. That is a clear and consistent signal that applying ED meaningfully improves your odds at RIT. RIT introduced a nonbinding Early Action round starting with the 2023 cycle, but the official CDS marks EA volume data as unavailable, so a precise EA versus RD comparison is not possible from the official record alone.
RPI's historical admit-rate picture is harder to reconstruct from official sources because its archived CDS files were not fully accessible for this analysis. What secondary CDS-derived data shows is that RPI's early-action advantage is less stable than RIT's ED advantage. In reconstructed figures, RPI's EA admit rate was around 63.3% versus a 52.5% RD rate in 2021, but by 2023 the two rates had converged, and by 2024 the RD rate in that secondary data set actually exceeded the EA rate. That pattern should be read cautiously given the sourcing, but the direction of it matters. At RIT, applying early gives you a well-documented statistical lift. At RPI, that lift is less clear in the available data.
For deadlines, RPI's fall 2026 materials list ED I on November 1 with decisions by December 13, EA on December 1 with decisions by January 31, and ED II on January 5. RIT's structure runs ED I on November 1 with decisions by December 1, ED II on January 1 with decisions by January 15, and EA on November 1 with decisions by January 31.
One thing worth flagging about RPI specifically. Its current admissions pages contain small but real inconsistencies. One page describes a test-optional policy running through fall 2030. Another says the policy will be reevaluated for fall 2028. A separate set of deadline listings shows slightly different ED II and RD dates than the main apply page. These are not dealbreakers, but if you are building a precise application calendar, verify directly with RPI's admissions office rather than relying on any single page.
Testing
Both schools are test optional. At RIT, the policy is stated simply and consistently across all available official materials. The school superscores both the SAT and ACT and encourages STEM applicants who submit ACT scores to include the science section. For the fall 2024 entering class, the middle 50% SAT range was 1300 to 1440, the middle 50% EBRW range was 640 to 720, the middle 50% Math range was 640 to 740, and the middle 50% ACT range was 27 to 33. About 43% of enrolled students submitted SAT scores and about 11% submitted ACT scores.
RPI's official materials describe the same general test-optional framework, with one exception. Students applying to the Physician-Scientist program must submit scores because of Albany Medical College's requirements. For the fall 2024 entering class, RPI's middle 50% SAT EBRW range was 670 to 740 and the SAT Math range was 705 to 770. RPI's math range skewing higher than RIT's is consistent with the school's more concentrated STEM identity.
If you are a strong tester, submitting scores at either school is worth considering. If your scores fall below the 25th percentile, withholding them is the standard strategic move under test-optional policy.
Curriculum and Career Outcomes
This is where the schools diverge most. RPI is built around research. RIT is built around employment.
That is a simplification, but not a misleading one. At RPI, the 14:1 faculty ratio and the undergraduate research participation rate above 70% signal a school where academic depth and research experience are the central product. The arts and creative programs at RPI exist in tight conversation with engineering and computation rather than as a broad standalone system. Architecture, Electronic Arts, Games and Simulation Arts and Sciences, and Music all receive special application treatment, which tells you they are selective and intentional rather than ornamental.
At RIT, the co-op machine is the story. In the 2024 to 2025 academic year, 4,365 students completed 5,825 work assignments with 2,058 employers and earned $65.67 million in co-op wages. That is not a career-services perk. It is a curricular philosophy. RIT also publishes salary and outcome data by program, which makes it far easier for applicants and families to assess specific majors in real terms. For Computer Science specifically, the class of 2024 reported an average first-year full-time salary of $90,200, a median of $85,000, and a 92.3% outcome rate.
At the institution-wide level, RPI's salary figures are higher. RPI reports an average starting salary of $86,000 for the class of 2023. RIT reports an average starting salary of $78,600 for the class of 2025, up from $76,500 for the class of 2024. But RPI's destination data also shows that 36% of its class of 2024 went directly to graduate or professional school, which affects how you interpret a salary headline that excludes that group. RIT's outcomes transparency is stronger for applicants who want to track specific programs rather than institutional averages.
Location and Cost
RPI's campus is roughly 10 miles from Albany International Airport and about 20 minutes by taxi. Campus-to-downtown transit runs through CDTA bus service and an on-campus shuttle system.
RIT is accessible via RTS regional bus service connecting Henrietta to Rochester and surrounding areas, plus its own free campus shuttle routes. Rochester's transit infrastructure is more robust than Troy's for students without a car, which matters over four years.
On cost of living, federal housing data for 2025 puts the fair-market rent for a two-bedroom unit at $1,487 per month in the Albany-Schenectady-Troy metro area and $1,427 per month in the Rochester metro area. The difference is real but modest. Rochester is slightly cheaper.
RPI's official 2024 to 2025 cost of attendance is $84,071. A precise comparable figure for RIT's current cost of attendance was not available in the same official source, but secondary estimates place it in a similar range.
Which School Is Right for You
Choose RPI if you want a smaller, more academically intense environment, you are drawn to a school where undergraduate research is a genuine expectation rather than an extracurricular, and you are comfortable with a campus culture that is narrower in scope but highly concentrated around a shared technical identity.
Choose RIT if you want a larger school with a more visible path from classroom to career, you place real value on co-op experience as a structured part of your education, you want access to a broader student-life environment that includes creative programs, a deaf-education community, and a well-developed Greek system, or you want program-level salary data before you commit.
If you are still working through which school belongs on your list, or how to position yourself in the application process at either one, schedule a consultation with an admissions expert today.