Analysis of the 2025-2026 College Admissions Cycle

If you spent this past year hearing that admissions has never been more competitive, you weren't wrong, but you also weren't getting the full picture. The 2025-2026 cycle, the one that produced the Class of 2030, wasn't a story of every school getting harder to get into. It was a story of divergence. A small group of nationally known institutions pulled further away from everyone else. Testing quietly came back into fashion at a handful of elite schools even as most of the country stayed test-optional. Binding Early Decision spread into public universities for the first time in a serious way. Optional video components and AI use both became more common without anyone quite agreeing on the rules. International demand softened while domestic access groups kept growing. Community colleges and transfer pathways expanded faster than almost anything else in the system.
If you're building a college list right now, or helping your student build one, understanding these currents matters more than memorizing a single admit rate. Here's what the data actually shows, and what you should take from it.
Applications Kept Growing, Just More Slowly
Nationally, the growth engine cooled but didn't stop. Through March 1, 2026, roughly 1.43 million applicants had submitted 9.42 million applications to Common App's matched group of returning member schools. Applicants rose about 2 percent, applications rose about 5 percent, and applications per applicant climbed from 6.41 to 6.59. Put another way, roughly three-fifths of the growth in total application volume came from students padding their lists rather than from more students entering the applicant pool in the first place.
In plain terms, students weren't discovering college in greater numbers. They were hedging harder, adding more schools to already long lists in response to unpredictable outcomes at the top of the market. And that hedging wasn't evenly split between public and private institutions. Through February, applications to public Common App members grew about 6 percent while applications to private members grew about 5 percent, a much narrower gap than the year before, when public applications had grown 10 percent against just 2 percent at private schools. Private institutions regained some relative momentum this cycle.
The Most Selective Schools Pulled Further Away
This is where the divergence shows up most clearly, and the pattern held across a wide range of institutions this cycle, not just the two or three names that usually make headlines. Yale's applications jumped 9.3 percent, and because its class didn't grow to match, its admit rate fell from 4.60 percent to 4.24 percent. Duke's applicant pool grew about 5.5 percent while its number of offers actually shrank, pulling its admit rate from roughly 5.2 percent down to 4.7 percent. Vanderbilt's applications rose a striking 17.1 percent while offers fell about 11.2 percent, cutting its admit rate by more than a full percentage point.
The most dramatic move happened at a public flagship, not a private university. The University of Virginia's applications rose approximately 27 percent while its offers grew only about 2 percent, pushing its estimated admit rate from 15.65 percent down to 12.53 percent in a single cycle. That's a reminder that selectivity swings aren't confined to the small Ivy-League-adjacent private schools your student's friends talk about. A well-known public flagship can get meaningfully harder to get into in one admissions cycle purely because national demand outpaced its ability to grow the class.
Not every highly selective school moved as sharply. Dartmouth's applicant pool grew only about 2 percent, a change small enough that it likely reflects normal variation rather than a meaningful shift, and Dartmouth deliberately withheld its early-round numbers during the cycle rather than publish them in real time. That distinction matters for how you read admissions headlines. A single-digit change in admit rate at one school can be a real signal of rising demand, or it can be statistical noise, and the difference usually isn't obvious from a press release alone.
The lesson isn't that "elite schools are all harder now." It's that demand can concentrate unevenly, hitting a public flagship as hard as a private university in one cycle, and hitting a similarly ranked neighbor barely at all. If your student's list is built around brand recognition rather than genuine fit and a realistic sense of scale, this is the year that strategy gets punished hardest. It's also worth knowing that many selective schools have simply stopped releasing full application, round-by-round, and yield data during an active cycle, which means the precise "Class of 2030 acceptance rate" tables circulating online often blend preliminary numbers with assumptions that aren't fully verifiable. Families with schools in California should also note that a new state law, AB 1780, barred private nonprofit colleges there, including Stanford, USC, and Caltech, from giving any admissions preference to legacy or donor-connected applicants starting this cycle.
Testing Made a Quiet Comeback
The headline you probably saw, that test-optional policies remain dominant, is technically true and also somewhat misleading. Only about 5 percent of returning Common App member schools actually required a test this cycle, unchanged from the year before. Yet the share of applicants choosing to submit a score anyway rose from 48.1 percent to 52.0 percent, crossing the majority line for the first time since before the pandemic.
Meanwhile, policy at the top of the market shifted underneath the aggregate numbers. Stanford, Penn, and Cornell required the SAT or ACT for fall 2026 applicants, joining Brown, Caltech, Harvard, Dartmouth, and MIT among schools that have reinstated or retained testing. Yale used a test-flexible policy for this cycle, during which it deferred about 18 percent of its early applicant pool, but announced it will require the SAT or ACT starting with the following cycle. Princeton and Duke, by contrast, remain test-optional, and the University of California system remains test-free for both admission and scholarships, with no change planned.
Students preparing to test also navigated a redesigned exam. The ACT became shorter this testing year, trimmed its question count, made the science section optional for national testers, and now calculates its main composite score from English, math, and reading alone. The SAT, meanwhile, has been fully digital for all U.S. administrations since spring 2024.
What this means practically is that "test-optional" no longer describes one coherent national policy you can plan around. It's a fractured landscape where the answer depends entirely on which school is on your list and which entering class you're applying to, since a policy page updated for next year may not reflect what applied to this one. Treat every school's testing policy as its own decision point, and think carefully about whether submitting a strong score could strengthen an application even where it isn't required.
Binding Admissions Spread Into the Public University Market
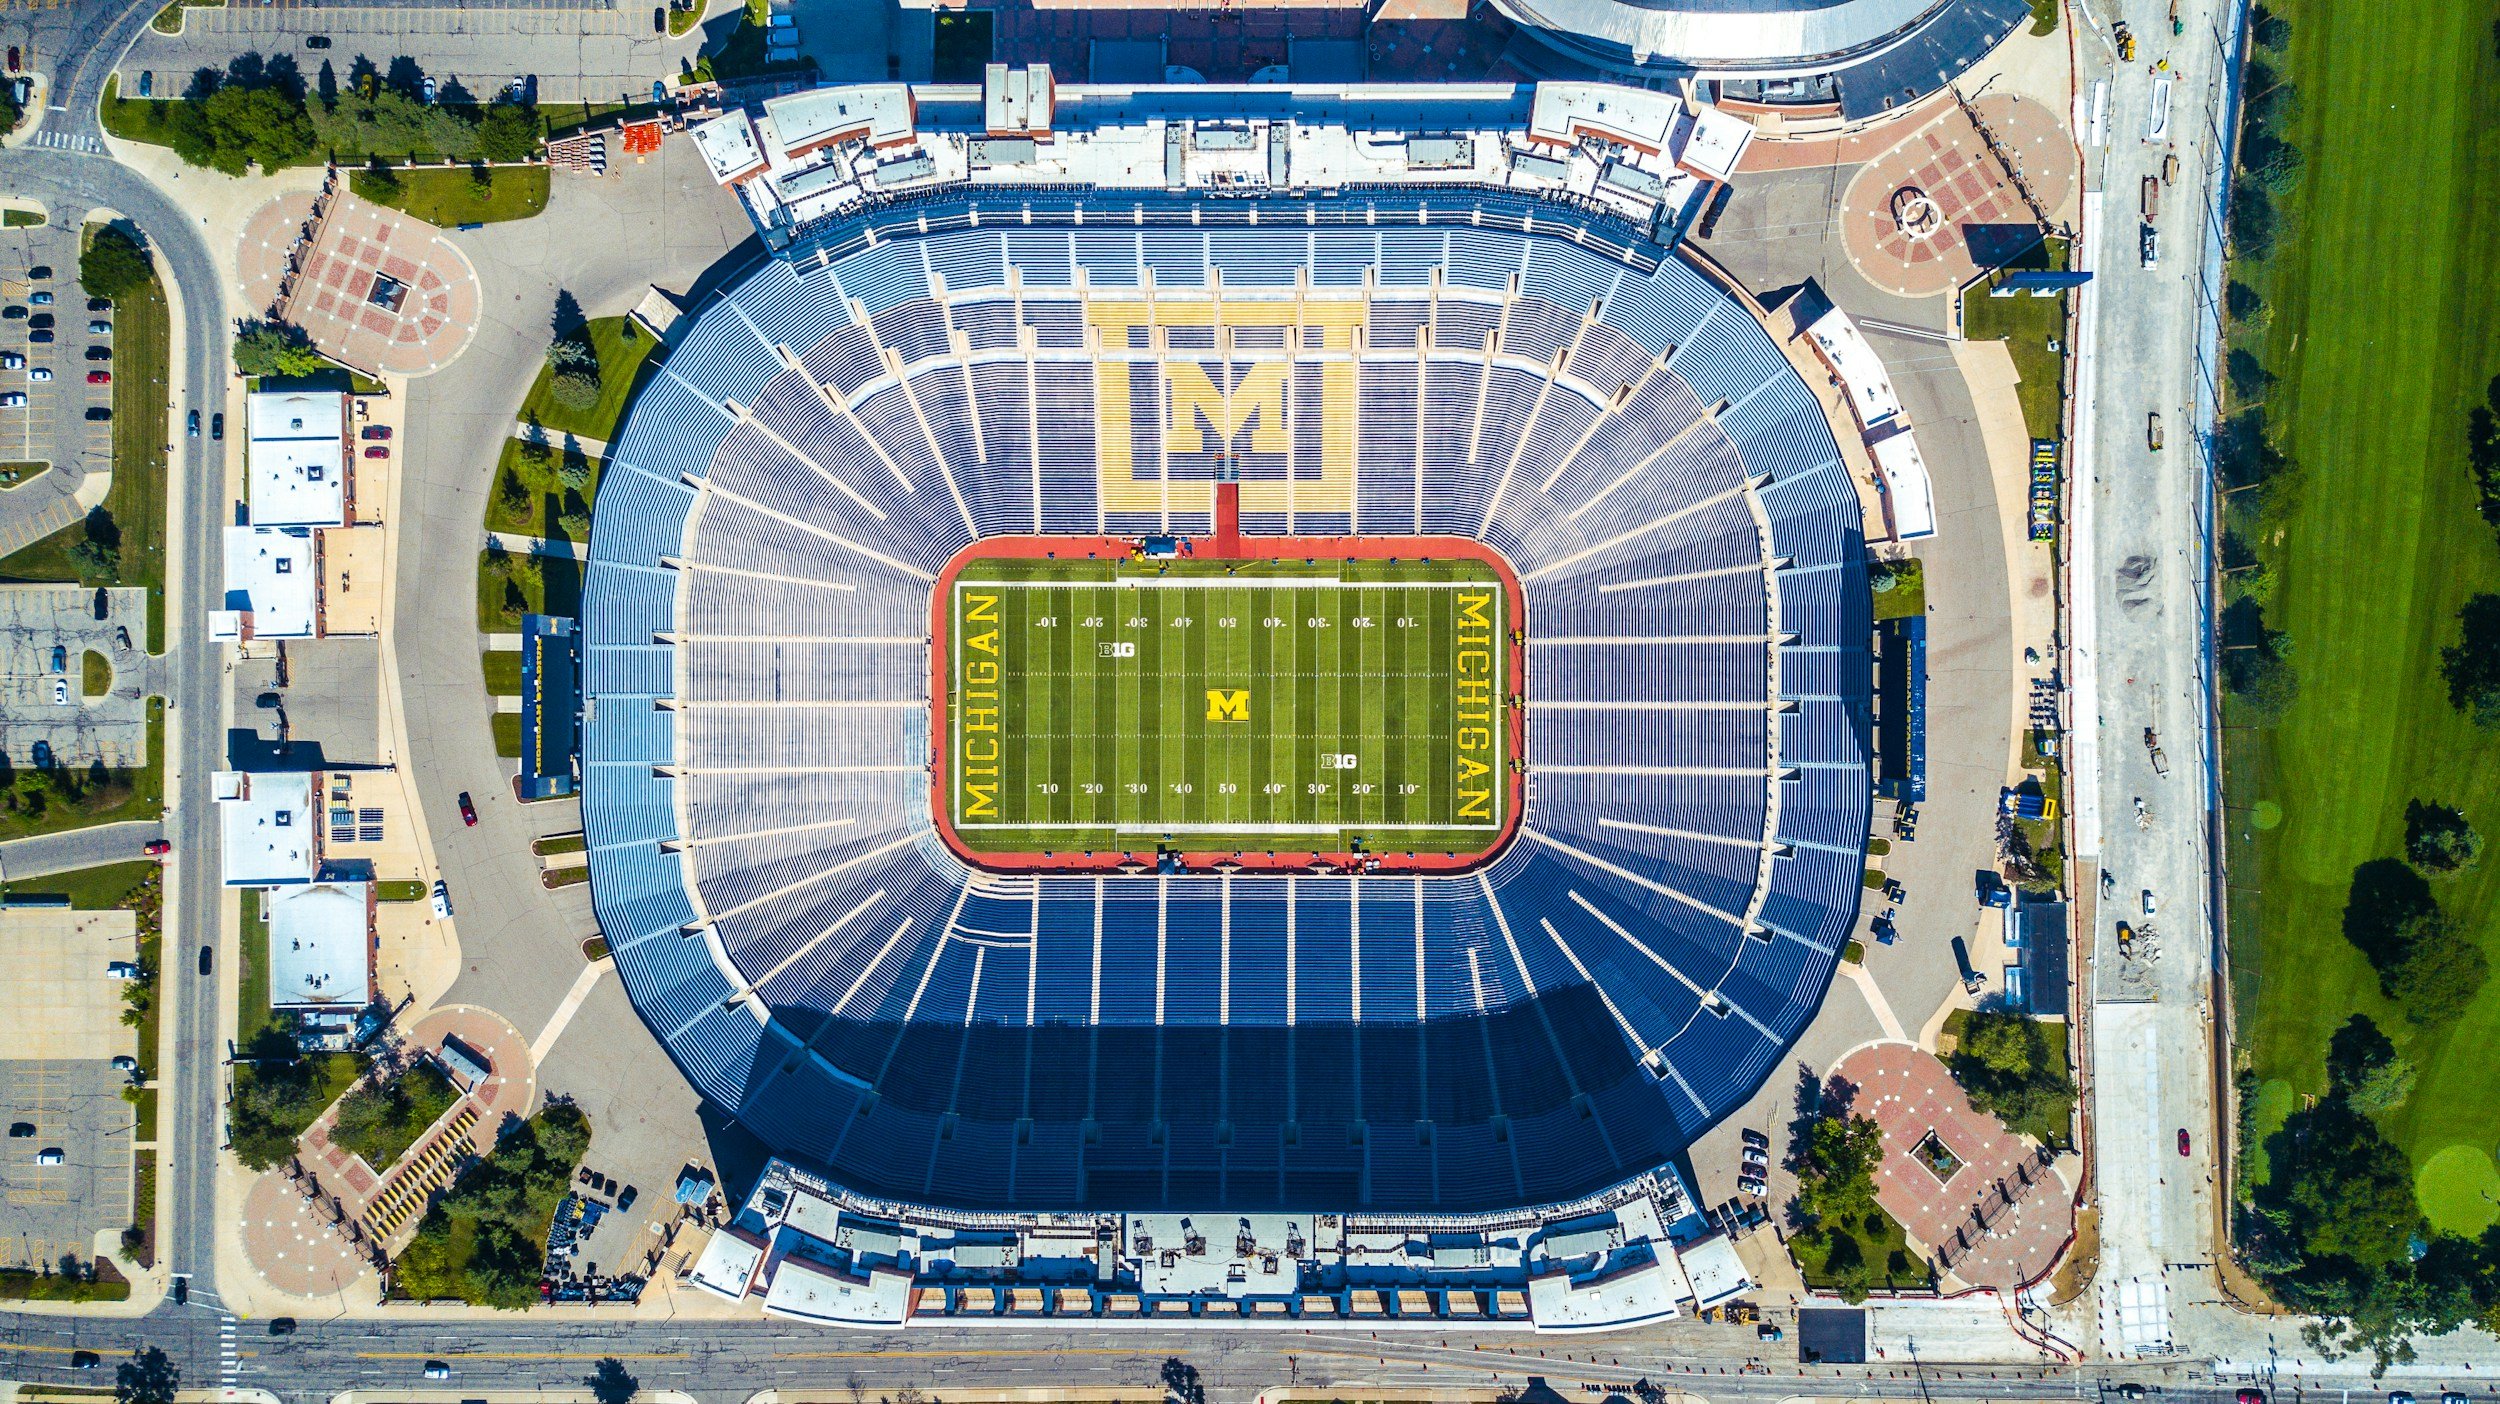
The most structurally significant change this cycle didn't happen at a private university at all. The University of Michigan introduced institution-wide Early Decision for fall 2026 applicants, the most consequential binding-admissions launch at a public research university this cycle. Applications were due November 1, with decisions by December 24 and commitments due January 6, and students whose ED applications were postponed into a later round were released from the binding agreement rather than denied outright. USC simultaneously piloted Early Decision for its Marshall and Leventhal undergraduate business and accounting programs, its only ED option this cycle.
Neither school released round-specific application, admit, or yield figures for their new programs, so any claim you see online about how much of an admissions edge ED provided at Michigan or USC this cycle should be treated as speculation rather than fact. What is verifiable is the trend line. The University of Connecticut ran its first ED cohort a year earlier, admitting roughly 60 percent of about 1,500 ED applicants. The University of Florida and USC have both announced broader binding Early Decision programs starting with fall 2027 applicants, and Vanderbilt received 7,727 Early Decision applications across its two rounds, a 14.3 percent increase from the year before, well ahead of the national applicant growth rate.
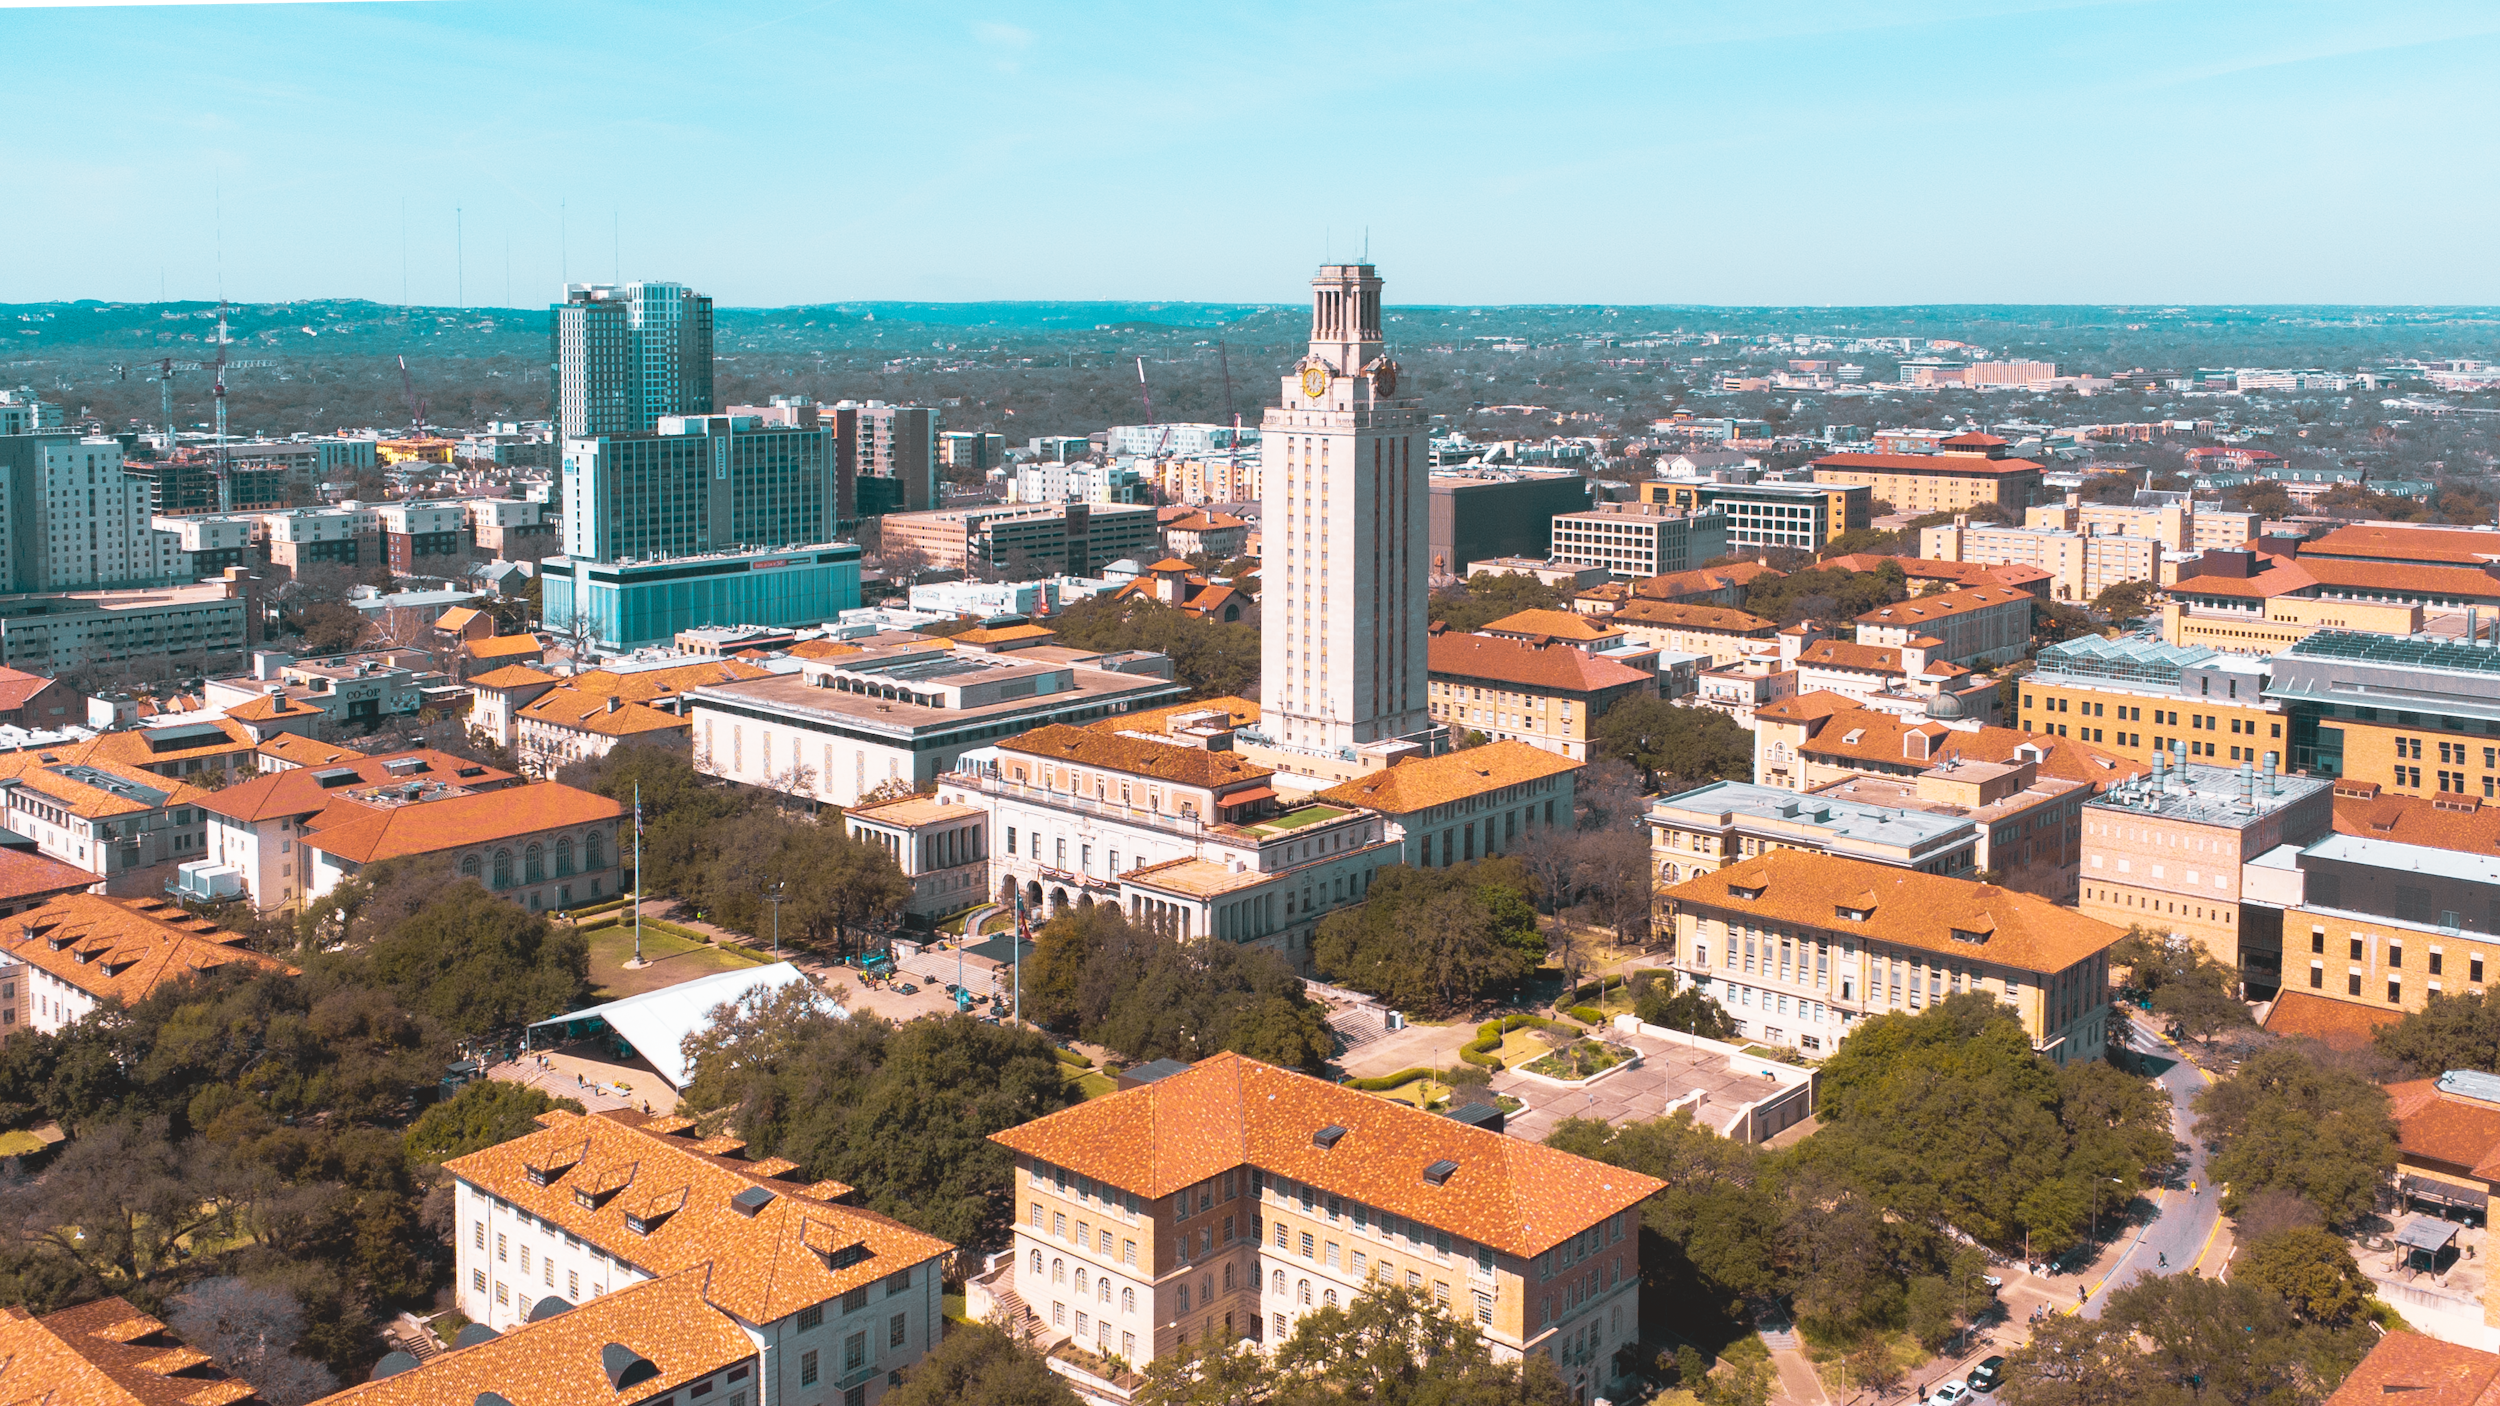
Not every large public university moved toward binding admission. UT Austin remained entirely nonbinding, but it tightened a different lever that matters just as much for Texas families. The automatic-admission threshold for eligible Texas students shrank from the top 6 percent of a high school class to the top 5 percent, starting with summer and fall 2026 applicants, which reduces the number of seats reserved for automatic admits and shifts more of the class into holistic review.
This matters for your planning in a very direct way. Binding admission improves a college's ability to lock in its class early, which is exactly why more public universities are adopting it. But committing to one school before you can compare financial aid offers is a real trade-off, not a free strategy boost. Use Early Decision only after running the net price numbers, and understand that an aggregate ED admit rate reflects a pool full of recruited athletes, legacy applicants where still permitted, and students with unusually strong demonstrated fit, so it tells you less about your own student's odds than it might appear to.
Optional Video and Interview Components Kept Multiplying
Written supplements remained the core of almost every application, but more schools added an optional way to show voice and personality beyond the essay. Duke, Brown, and Washington University all accepted a short applicant video this cycle, typically through the Glimpse platform or a similar tool, with Brown suggesting a video of no more than about 90 seconds. Bowdoin went a step further, offering an optional two-minute response to a randomly assigned prompt with limited preparation time, designed to capture something more spontaneous than a polished, rehearsed submission. Caltech used short video conversations in select cases specifically to verify unusually advanced research claims in an application, not as a general interview requirement.
None of these are becoming mandatory, and schools that offer them are generally explicit that skipping the video carries no penalty. Treat an optional video the way you'd treat any other optional component. It's worth doing if it genuinely adds something a transcript and essays can't, like a sense of humor, a spoken language, or a passion project that's hard to convey on paper. It's not worth doing if it's going to feel forced, over-rehearsed, or like one more box to check.
AI Use Outpaced Every School's Official Policy
This is worth understanding clearly, because it affects how your student should actually write their essays this cycle. Survey data suggests generative AI use in applications was already widespread. One nationwide survey of high school seniors and educators found that about 30 percent of students used generative AI in connection with their personal essays, and about 31 percent of teachers used it while drafting recommendation letters. A separate survey of one selective university's incoming class found that nearly half of respondents had used some AI-related writing tool, though most of that usage was lighter-touch tools like Grammarly rather than a chatbot generating original content.
Admissions offices, meanwhile, were nowhere close to a unified response. A 2025 survey of more than 200 admissions officers found that only about 2 percent explicitly allowed AI to write an essay outright, roughly 30 percent explicitly banned AI-generated essays, and a full 68 percent had no official policy at all. The numbers looked similar for AI-assisted brainstorming and feedback, where most offices simply hadn't drawn a formal line yet.
What this means for your student is straightforward, even if the institutional rules aren't. There's no reliable, universally trusted technology that flags AI-written essays without a real risk of false positives, so schools are leaning more on comparing an applicant's writing across their whole file, on interviews, and on tools like Caltech's verification conversations rather than on detection software alone. The safest and most effective approach is to use AI, where a school's policy allows it, only for things like brainstorming topics, checking grammar, or getting feedback on a draft, and to make sure the actual reflection, story, and voice in the essay are unmistakably your student's own. That's also simply the version of the essay that reads best to an admissions officer reviewing thousands of files.
Who Applied More, and Who Applied Less
Domestic access-oriented growth continued this cycle, just at a slower pace than the unusually strong year before it. Fee-waiver-eligible applicants grew 6 percent. Applicants from below-median-income zip codes grew 8 percent, the same rate as the year before. First-generation applicants grew about 6 percent, a real deceleration from roughly 13 percent growth the prior cycle. Black applicants grew approximately 9 percent through February, among the fastest-growing groups nationally. Rural applicants grew 8 percent, actually accelerating from the year before and outpacing metro-area growth.
QuestBridge added another access channel worth knowing about if your family qualifies. Its National College Match identified 7,026 finalists and matched 2,550 students from lower-income backgrounds with full four-year scholarships across 55 partner colleges, giving strong students from modest-income households an early, high-aid path into selective institutions outside the standard application timeline.
Public university systems kept absorbing enormous volume on their own. The University of California reported more than 205,000 first-year applications for fall 2026 and admitted a record 102,031 California residents systemwide, while the California State University system logged more than 833,000 campus applications, a figure that counts individual campus submissions rather than unique students, since one applicant can apply to several CSU campuses at once.
International demand told the opposite story from domestic access growth. Common App international applicants fell about 9 percent, compared with just a 1 percent decline the year before, with steeper declines out of Africa and Asia specifically. India fell 14 percent, Nigeria fell 17 percent, and Ghana fell 34 percent, while applicants from the Americas actually increased. Interestingly, this decline wasn't universal. The University of California system saw its international first-year applications hold essentially flat, which tells you the softness varied by institution and application channel rather than reflecting one uniform national trend.
If your family is applying from outside the United States, or your student is weighing schools with heavy international enrollment, build in geographic and timing contingencies rather than assuming last cycle's numbers will repeat.
The Map Is Shifting South and West
One quieter trend worth knowing about is where applicants are actually coming from. Texas has become one of Common App's largest and fastest-growing applicant states, up about 8 percent this cycle, ahead of New York, California, and Florida. Dartmouth reported that 54 percent of its admitted class now lives in the South, the West, or outside the United States entirely. Longer term, WICHE projects that the national pool of high school graduates peaked at roughly 3.9 million in 2025 and will decline gradually afterward, falling about 13 percent by 2041, with that contraction hitting some states and regions far harder than others.
If Texas is part of your student's plan, that UT Austin automatic-admission tightening mentioned earlier is worth flagging again here, since it directly affects how many Texas students get in purely on class rank versus how many now compete in holistic review. None of this means competition at national and global-demand schools is about to ease up. It means recruitment pressure will keep building fastest at regional colleges dependent on shrinking local populations, while the geographic center of gravity for applicants keeps moving toward Texas, Florida, and the broader Sun Belt. If your family is in a growth region, expect more direct outreach and merit offers from schools trying to recruit you. If you're in a region with a shrinking graduating class, it may work in your favor at less selective institutions actively competing for enrollment.
Transfer and Community College Pathways Kept Expanding
One of the clearest growth stories this cycle had nothing to do with first-year admissions at all. University of California transfer applications rose 3.5 percent, and applications specifically from California community colleges rose 6.7 percent, the strongest volume increase anywhere in the UC system. Nationally, transfer enrollment rose 4.4 percent, and transfers now make up 13.1 percent of continuing undergraduate enrollment, up from 11.9 percent five years earlier.
For students who don't get the outcome they wanted this cycle, or who are rethinking their path for financial reasons, transfer is looking less like a fallback and more like a legitimate, well-supported route into selective institutions. It's worth treating as a deliberate plan with articulation agreements and a clear course sequence in mind, not an afterthought.
College Got More Expensive While Aid Got More Available
Sticker prices rose across every sector this cycle. Private nonprofit four-year tuition and fees rose 4.0 percent to roughly $45,000. Public four-year in-state tuition rose 2.9 percent. The maximum Pell Grant, meanwhile, stayed flat at $7,395, meaning its purchasing power against rising tuition quietly eroded.
The good news is that the aid process itself worked much better this cycle than it had the year before. By late June 2026, an estimated 59.1 percent of the high school Class of 2026 had completed the FAFSA, up from about 53.9 percent for the Class of 2025, a record completion rate that reflects the aid system recovering from its earlier rollout problems. The 2026-2027 FAFSA also became available on its normal fall timeline rather than facing another major delay.
Colleges leaned harder on institutional grants to convert admits into enrolled students. The preliminary tuition-discount rate at private nonprofit colleges for first-time, full-time students rose to about 57.1 percent, up from roughly 56.3 percent the year before, meaning the typical private college is now collecting less than 43 cents of net tuition for every sticker-price dollar before you even factor in students paying full price. At the very top of the market, the wealthiest institutions moved even further in the same direction. Harvard expanded free attendance to families earning up to $100,000 and full tuition coverage up to $200,000. Yale matched that structure. Princeton raised the income level below which families pay no tuition to $250,000. MIT expanded its own tuition-free threshold, and Emory announced free tuition for qualifying families earning up to $200,000 starting this fall. These moves widen the gap between what a family actually pays at a handful of extremely well-endowed schools versus everywhere else, even as everywhere else raises its sticker price.
The practical takeaway is that published price tells you almost nothing on its own. Run net price calculators early, file the FAFSA as soon as it opens given how much earlier and more reliable the process has become, and make sure at least one school on your list is affordable without depending on a competitive scholarship coming through.
Waitlists Are Doing More Work Than They Used To
It's worth knowing that admission decisions released in December and March are not always the final word. A recent survey of nearly 3,000 college applicants found that 32.4 percent had been waitlisted at least once, and among those waitlisted, only about 19.6 percent eventually received an offer, with roughly 48 percent of those offers arriving after the traditional May 1 decision date most families plan around.
Michigan's own data show just how unevenly that plays out. The school offered a waitlist spot to over 18,000 applicants in each of the last two cycles, and the share who eventually got in nearly doubled, from about 5 percent for fall 2024 to about 9 percent for fall 2025. Contrast that with two heavily demanded Cal State campuses, where waitlist movement barely registered. Long Beach admitted only about 1.2 percent of its waitlisted students, and San Diego State admitted about 2.3 percent. Being waitlisted at one school can mean something close to a real second chance, and at another school it can mean something close to a formality, and there's usually no way to know in advance which one applies.
That's also part of a broader shift toward more flexible entry points beyond the traditional fall decision. UT Austin, for instance, piloted a new Spring Start program this cycle, offering selected applicants a path through Austin Community College into spring 2027 admission rather than a fall first-year seat. Don't treat a March decision as the absolute end of the process, in either direction, and don't assume every alternative offer you receive is a downgrade.
Every one of these decisions is easier to get right with a clear read on where the data actually points rather than reacting to whatever admissions headline circulated last week. That's the kind of planning we do with families every day at Cosmic College Consulting. If you'd like help turning these trends into an actual strategy for your student, schedule a consultation and let's build the list together.